Syllabus
- Week 1, Day 1: 2017-09-26
- Week 1, Day 2: 2017-09-28
- Week 2, Day 3: 2017-10-03
- Examples of reaction to the Vegas shooting
- Anecdotes as data: NYT on Human Toll of Terror
- Naming things is hard
- Week 2, Day 4: 2017-10-05
- Week 3, Day 5: 2017-10-10
- Week 3, Day 6: 2017-10-12
- Week 4, Day 7: 2017-10-17
- Working through SQL together
- As class starts
- Week 4, Day 8: 2017-10-19
- Week 5, Day 9: 2017-10-24
- Week 5, Day 10: 2017-10-26
- Week 6, Day 11: 2017-10-31
- Week 6, Day 12: 2017-11-02
- Week 7, Day 13: 2017-11-07
- Week 7, Day 14: 2017-11-09
- Week 8, Day 15: 2017-11-14
- Week 8, Day 16: 2017-11-16
- Week 9, Day 17: 2017-11-28
- Week 9, Day 18: 2017-11-30
- Week 10, Day 19: 2017-12-05
- Week 10, Day 20: 2017-12-07
Week 1, Day 1: 2017-09-26
What is data journalism? (class discussion)
The Wikipedia snippet highlighted by Google when you search for what is data journalism:
Data journalism is a journalism specialty reflecting the increased role that numerical data is used in the production and distribution of information in the digital era.
What is public affairs? (class discussion)
From the syllabus of the Fall 2001 session of Public Issues Reporting I at Stanford:
Public issues journalism can be defined as narrowly as the coverage of government and as broadly as the coverage of the public life of the American people – the sum of their activities involving public institutions and public policies.
Another viewpoint: Why Normal People Don’t Trust Data Journalism
Lessons/Notes
Week 1, Day 2: 2017-09-28
The Type of People You Chose to FOIA
(a quick lesson about data collection, aggregation, pivot tables, and the color of our history/society)
About that Google Form you filled out:
https://docs.google.com/forms/d/1yTM-CXHT4RFIT8S1lrOWe5UYD8sfr7ZHJc1Ag3EGctM/edit
Here are the results in spreadsheet form:
https://docs.google.com/spreadsheets/d/1J8rnGqMF0N02IUIlK-QjEARRNQIFag_SekPt4ztdxAI/edit#gid=0
Stanford’s Tuition Rates
On the previous Tuesday, your assignment was to represent Stanford tuition data using a hand-drawn chart. Let’s take a look at them, discuss what went terrible, and also, what to remember going forward with data visualization (especially computer-powered).
More important than the aesthetic design, though, is the ability to understand the data, especially its limits. And later on, how to think of a single dataset in terms of what other datasets bring to it in tandem. Richness of data and insight is what drives great visualizations.
In-class walkthrough of all the charts we can do (to be continued):
Anecdotes as data: NYT on Human Toll of Terror
Must reads:
NYT: Human Toll of Terror: https://www.nytimes.com/interactive/2016/07/27/world/human-toll-of-terror-attacks.html
USA Today take on terrorism in 2016: https://www.usatoday.com/story/news/world/2016/06/29/major-terrorist-attacks-year/86492692/
Naming things is hard
- ` What is terrorism? <https://www.nytimes.com/2017/10/02/us/politics/terrorism-las-vegas-attack.html>`_
- What is the US’s “deadliest” mass shooting?
- What is a mass shooting?
- What is a “hate crime”?
- What is a murder
- What is a homicide
Week 2, Day 4: 2017-10-05
Assignments
- Background reading on Lena Groeger
- CanViz: Popular surnames as recorded by the U.S. Census [2017-10-11]
- Logging a Catalog of Public Data Catalogs [2017-10-09]
- Read: In Baltimore, No One Left to Press the Police, by David Simon
- Read: Meet the Man Who Spends 10 Hours a Day Tracking Police Shootings, with D. Brian Brughart.
Sidenote: An example of what I hope to see for the end-of-quarter work: Project: Data-Expanded Story
Data wrangling and research
From last class, Mojo’s mass-shootings spreadsheet (maybe I’ll try to do a quick pivot on their data):
Landing page for US Mass Shootings, 1982-2017: Data From Mother Jones’ Investigation
- Direct link to class copy of MJ’s mass shootings data (i.e. the first sheet only), on Google Sheets) – use this for class
- Direct link to MJ’s official Google Sheet for its mass shootings data <https://docs.google.com/spreadsheets/d/1XV4mZi3gYDgwx5PrLwqqHTUlHkwkV-6uy_yeJh3X46o/edit#gid=0>_
Raw text as data
(from the previous Thursday; some we’ll push into next Thursday)
Before we jump head first into databases, it’s important to understand that for the vast majority of real-world situations, text is data. Whether it’s in a text editor, a spreadsheet, or SQLite.
A story for our times: Court Computer Says All Hartford Is Dead
Court officials have figured out why Hartford residents were excluded from Federal grand jury pools over the past three years: The computer that selected names thought everyone in the city was dead…
The city’s name had been listed in the wrong place on computer records, forcing the “d” at the end of “Hartford” into the column used to describe the status of prospective jurors. “D” stands for dead.
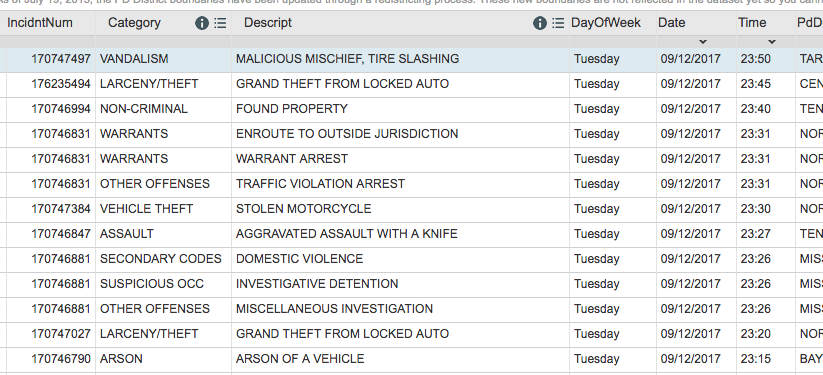
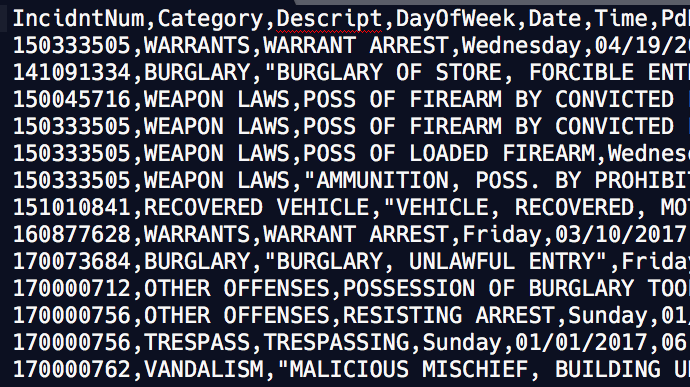
The importance of delimiters
By the end of today, understand why this seeming chaotic jumble of plaintext is as much “data” as its equivalent spreadsheet:
Week 3, Day 5: 2017-10-10
Prep
On Thursday we’ll go into databases (and their relation to spreadsheets). For now, take a quick skim of this lesson/tutorial from last year:
Getting to Know SQLite with a Client and a Database
And all you have to do is try to get DB Browser for SQLite installed on your own machine. Let me know if you run into any issues.
Thoughts about collaborative data
Here’s a spreadsheet with all of the class’s self-driving records:
https://docs.google.com/spreadsheets/d/13LrOPcRvWtYEoqvpjX-GWeF_g5rHOTnKZcpjU-3bbpw/edit#gid=0
(from this assignment CA’s Autonomous Traffic Accident Reports [2017-10-02])
Here’s a copy of the catalog of catalogs:
https://docs.google.com/spreadsheets/d/18fc2kYP6echk2HTsW2c-uxqV9p5l3H95B6mdhX2g8XQ/edit#gid=0
Week 3, Day 6: 2017-10-12
About SQL and SQLite
In-class demonstration. Let’s use Palo Alto pay data:
Categorical vs. Continuous data
A work in progress in terms of a walkthrough covering spreadsheet/data tips/basics:
The Census surname data is an example of data with a lot of continuous variables.
For a class example:
Working through SQL together
Slow, hands-on exercise to make sure everyone can do the mechanicsl steps. You’ll also have a lot of reading to do by Thursday.
Random notes that will be streamlined into a guide: What to Focus on when Learning on SQL for a Day
As class starts
Download: ssa-babynames-nationwide.sqlite
Use DB Browser to open the ssa-babynames-nationwide.sqlite file. Follow this guide: Getting started with SQLite Browser
Questions to ask: SQL Counting/Sorting/Filtering (Questions)
The answers: SQL Counting and Filtering Lesson `
Note
note
(we probably won’t get to these other two):
Assignments
Besides the CanViz, nothing to turn in. But a couple of things to do:
- Sign up for a free account on MuckRock if you haven’t already. Email me with what username you used so I can add you to our MuckRock organization. Start thinking about what California-level government you’d like to make a public records request to,,,
The concepts covered in today’s SQL lesson should let you answer the questions below. Rather than make a new assignment page for these small questions, I’m going to add them to the weekend homework:
The top 10 baby names of all time
Display the columns:
name,sex,count,year, in descending order ofcountFor the female name ‘Jennifer’, how popular it was in 1960, 1990, and 2010
Display just the
countandyearcolumn, in ascending order ofyearThe 5 least popular years for the name Michael among males
The 10 most popular names in 2010 that begin with the letter ‘Z’ but do not end in a vowel
The 10 longest names, after 2010, with at least 12 characters
In-class work/demo
Practice questions: SQL Counting/Sorting/Filtering (Questions)
Lesson with answers and notes and references: SQL Counting and Filtering Lesson
Sample Q: Hillary using ssa-babynames-nationwide data
This is based off of the blog post from Hillary Parker, Hilary: the most poisoned baby name in US history
Using ssa-babynames-nationwide.sqlite, let’s explore the popularity of “Hillary”.
We don’t know yet how to do to do GROUP BY and JOIN in SQL, so we don’t have an efficient to find how poisoned the name ‘Hillary’ apparently is. But we can do the first part of Parker’s analysis, which is to get thge list of years and baby counts associated with girl babies.
Example of creating SQL, step-step-by-step
For reference, spreadsheet of smaller scope of dataset: ssa babynames 1985 and 2016
Pretend we wanted to know the answer to the following question:
The 10 most popular names in the year 1985 that:
- Have at least 6 characters
- Begin with a vowel
- End with ‘x’ or ‘z’
Here’s how I would start writing that query, as a beginner:
Just ask for everything – all rows and columns, sloppily as possible
select * FROM babynames;
Ask for specific columns, and ask for a limit:
select name, sex, year, count
FROM babynames
limit 10;
Make it better formatted:
SELECT
    name, sex, year, count
FROM
    babynames
LIMIT 10;
If you’ve forgotten what a function does, test it out
SELECT
    name, sex, year,
    SUBSTR(name, 1, 1),
    SUBSTR(name, -1)
FROM babynames;
- Test out each boolean expression indivdiually
SELECT
    name, sex, year, count
FROM babynames

WHERE
  year = 1985
  AND SUBSTR(name, -1) = 'z'
   OR SUBSTR(name, -1) = 'x'

ORDER BY COUNT DESC
LIMIT 10;
etc….
- The end
SELECT
    name, sex, year, count
FROM babynames
WHERE
  year = 1985
  AND SUBSTR(name, -1) IN ('z', 'x')
  AND SUBSTR(name, 1, 1)
        IN ('A', 'E', 'I', 'O', 'U')
ORDER BY COUNT DESC
LIMIT 10;
Week 4, Day 8: 2017-10-19
Let’s MuckRock: https://www.muckrock.com
The site is pretty easy to use, but you can follow these instructions from last year’s homework as a reference: http://2016.padjo.org/assignments/foia-records-fun/
Week 5, Day 9: 2017-10-24
Thinking ahead about INNER JOINs (why we are learning so much syntax)
Assignments
- 4 separate exercise sets, due this week: SQL Excercises with SFPD
- Muckrock-powered records request in California (if you haven’t already)
Guest lecture: Jeremy Singer-Vine, Data Editor; BuzzFeed Investigative Unit
https://www.buzzfeed.com/jsvine
His homepage: https://www.jsvine.com/
He also runs Data is Plural, a A weekly newsletter of useful/curious datasets.
Week 5, Day 10: 2017-10-26
Can-Viz voting
Get started on this: https://github.com/stanfordjournalism/can-viz-padjo-2017
Read this Daily story when you’re done:
https://www.stanforddaily.com/2017/10/25/hate-crimes-increase-on-campus/
Assignments
By Friday midnight
- Parts 3 and 4 of SQL Excercises with SFPD
Past assignments
Answers to SQL exercises part 1 and 2:
- https://gist.github.com/dannguyen/d06f8fb41722dd777c70acf83b1e03ad
- https://gist.github.com/dannguyen/0dfb75e0cead36b8e1125f0c41b14a1b
Answers to Palo Alto Pay Aggregated, 2014 vs 2016 [2017-10-16] have been added, in pivot tables and SQL:
Topics
SQL group by, having basics
(Whatever review is necessary)
Next week can-viz: California high school performances
http://stash.padjo.org/data/cdeschools.sqlite
A database that includes:
- SAT score performance by school: 2014 - 2016
- ACT score performance by school: 2014 - 2016
- School free/reduced lunch participation (2015-2016)
Just need to get the documentation together:
- California Dept. Ed page for high school testing: https://www.cde.ca.gov/ds/sp/ai/
- SAT data record layout: https://www.cde.ca.gov/ds/sp/ai/reclayoutsat16.asp
- ACT data record layout: https://www.cde.ca.gov/ds/sp/ai/reclayoutact16.asp
- FRPM: https://www.cde.ca.gov/ds/sd/sd/filessp.asp
Random Daily discussion
It’s time to start about what data means when doing journalism. Here’s a Daily story this week this ostensibly is about data, i.e. hate crime data, but doesn’t do enough of what I believe data journalists (should) do. This critique isn’t necessarily about the reporter, but rather what could be challenged/elaborated on if the reporter had more time to develop the story into a feature:
Six instances of hate crimes were reported at Stanford last year, including four instances of vandalism, one threat of physical violence and one battery. This compares with two incidents in 2015 and three in 2014.
According to Lauren Schoenthaler, senior vice provost for Institutional Equity and Access, hate crimes violate fundamental community standards at Stanford.
“Even one hate crime is one hate crime too many,” Schoenthaler said…
…Clery Compliance Coordinator Annette Spicuzza suggested that the increase in 2016 may be a result of an increase in actual reports rather than an increase in crimes themselves.
“I think people may be more willing to report, and that may be part of it,” she said.
Week 6, Day 11: 2017-10-31
Assignments
Practice – you don’t have to turn these in, just actually do them and make sure you (kind of) understand them: SQL Join Practice with Twitter and Tweets
Past assignments
Answers to SQL exercises part 1, 2, 3, 4:
Week 6, Day 12: 2017-11-02
(More SQL, including LEFT JOINS and self-joins)
Readings about data and data-issues
Articles and background information about a few real-world datasets that you’ll be writing queries for. As I’ve said before, SQL is something that you can eventually master in a quantifiable way. The “hard” problem of data journalism is understanding the real-world issues and implications of data – everything to why and how data is collected, how a datapoint relates to its corresponding real-world observations, and all the political and ethical issues of the data and its analysis.
Being familiar with the issues of data is hard work, but the more familiar you are with data and its domain, the easier it’ll be to focus on the SQL query writing.
SQL readings on LEFT JOIN
The last major concept about SQL that I think is worth covering is the LEFT JOIN. Very similar in syntax to INNER JOIN, but with a different set of results. Easiest way to explain is that INNER JOIN only returns combo-rows when there is a match between the different tables.
In contrast, LEFT JOIN returns rows that exist in the “left” (the table first referenced) table, whether or not they have a matching row in the joined table – it’s easier to demonstrate than to explain. The upshot is that – whereas INNER JOIN efficiently finds when a thing exists in 2 different tables – the LEFT JOIN efficiently finds when a thing exists in one table but not the other, which can lead to interesting and otherwise very-hard-to-find stories.
- SQL Left Joins
- Using LEFT JOINs to find what’s missing from one table to another
- StackOverflow: What is the difference between “INNER JOIN” and “OUTER JOIN”? (“LEFT OUTER JOIN” is an alias for “LEFT JOIN”)
(stuff that was covered sort-of during class)
Readings before class
Stories about interesting outliers
Homicide in New York City is not very interesting, or at least dramatic, due to the trend in falling crime rates. However, there are enough homicides to make covering every homicide a very costly task.
So the NYT ran a series that focused on one slice of overall city crime: the precinct with the most deaths.
A Bronx Precinct Where Killings Persist
If you have time: A Mother Is Shot Dead on a Playground, and a Sea of Witnesses Goes Silent
Answers to previous homework
Here you go: `answers to sql-join-ca-schools`_
Also in that section, more questions/queries to ask.
Real-world SQL data
Fatal Encounters and Census data: https://github.com/dannguyen/fatal-encounters-and-census-sql
SF lobbyist data: https://github.com/dannguyen/sf-ethics-lobbyist-sql
NYC crime data: https://data.cityofnewyork.us/Public-Safety/NYPD-Complaint-Data-Historic/qgea-i56i
Week 7, Day 13: 2017-11-07
SF Health Inspection Data
Going to focus on this dataset before looking at police dataset:
https://github.com/dannguyen/sf-restaurant-inspections-sql-gis-fun
Week 9, Day 17: 2017-11-28
Sorry for the lateness of this. Will try to be as brief as possible.
- Set up a data story appointment: Email me about what time this week (I guess there’s no reason I can’t do it Friday) that we can meet for a 15-min or so chat about the kind of story you want to do. And if you can, email me URLs to stories related to your idea so I can get a head start in gathering resources for you.
- If you want to do a summer internship interview for the Bee, email me what time from 11:15 to 12:30, or 3:00 to 3:30 you’d like to talk to Phillip. This isn’t an interview where it’s pass or fail, it’s casual, and you’ll learn as much about what the work might entail as he will about what you want to do. Bring a resumé. Feel free to ask me to give it a lookover if you want.
- The takehome midterm, actually, the final. I’ll send it out when it’s ready, hopefully sometime tomorrow. It will be due next Tuesday.
- Finally, readings for Phillip Reese visits:
Ideally, try to check out all the given links. But at the very least, read the following 3 stories from Phillip’s Pulitzer-finalist entry in investigative reporting, as they represent the spectrum between human-focused feature and compelling data package.
The project looked at how a certain Nevada mental health hospital, desperate for space and resources, dealt with overpopulation by giving patients Greyhound bus tickets to where patients wanted – or at least thought they wanted to go. As you can imagine, sometimes this ended badly.
Part 1: Cast out of Nevada, mentally ill man tells story of finding kindness in Sacramento http://www.sacbee.com/news/investigations/nevada-patient-busing/article2577125.html
The first story happened because a strange man walked from the bus into the nearest Sacramento police station. Phillip and his colleague Cynthia Hubert wrote a powerful profile about this man’s long and confusing journey, which included calls to the Nevada hospital. Phillip can explain more when he’s here, but if I remember correctly, they did not initially expect this longform profile of a single man to become a series or a data-backed investigation.
Part 2: Busing of patients rife in Nevada http://www.pulitzer.org/files/2014/investigative-reporting/sacbee/02sacbee2014.pdf
The follow-up to the first story, a week later, opens up with a nationwide map showing where the Nevada hospital’s patients ended up. Phillip can talk about the data behind the map and how painful it was to collate (always the hardest part!), but you can see that the map, while it looks nice, is actually a very basic map, one you can easily make in Carto, and one that bears the major flaws that come with every map.
And yet this is the story that turned a one-off human interest story into one of nationwide interest. I think Phillip says that it was more the map than anything.
Final part: Mental patients bused – and crime followed http://www.sacbee.com/news/investigations/nevada-patient-busing/article2586237.html
You can read the other stories that Phillip and Cynthia produced over the years, but the last installment (at least of the Pulitzer project) is a fine example of how we can, with the same base data, have a completely different angle and compelling story.
Editor’s note: http://www.sacbee.com/news/investigations/nevada-patient-busing/article2595722.html
These other stories are more one-off features in which the visualization is the respective main feature. Even though Phillip is the “data guru” at the Bee, you can see from his Pulitzer work that he is as good as any enterprise/investigative reporter in producing long-form, hard-hitting stories.
But he can also rip out interesting data features – short bites – on any dataset he comes across. He’s a great technician, but it’s more about just knowing what’s interesting about data in general (hint: outliers, and making comparisons)
Why we still kill cougars: http://www.sacbee.com/news/state/california/article182397016.html
Final tally: See how every Sacramento neighborhood voted in 2016 election http://www.sacbee.com/site-services/databases/article113389333.html
More guns sold in California last month than any other month on record http://www.sacbee.com/site-services/databases/article53245015.html
The achievement gap grew in 2016 under California Common Core. See it in your community. http://www.sacbee.com/site-services/databases/article37234650.html
Notes from last year’s visit: http://2016.padjo.org/articles/phillip-reese-data-journalism/
Week 9, Day 18: 2017-11-30
Guest lecture: Phillip Reese, Computer-Assisted Reporter; Sacramento Bee
Reese was a finalist for the 2014 Pulitzer Prize in Investigative Reporting
For their probe of a Las Vegas mental hospital that used commercial buses to “dump” more than 1,500 psychiatric patients in 48 states over five years, reporting that brought an end to the practice and the firing of hospital employees.