INNER JOINs with CA schools, poverty, and tests [2017-11-01 23:59]
Use SQL to aggregate California education data to chart the correlation between SAT and ACT performance, and SAT performance and student poverty.
Attention
- Description
- A test of INNER JOIN using California high school data and test scores
- Due
- 2017-11-01 23:59
- Slugline:
padjo-2017 homework sql-join-ca-schools your_sunet_id
In the body of the email, include:
- A link to the Google Spreadsheet that contains the aggregated data and resulting charts.
- The SQL code needed to answer both questions
Background
The California Department of Education tracks many kinds of data for all of its schools. This exercise is meant to be a quick acquaintance with a couple of different departments and their datasets. For this exercise, I’ve put the data into a database for you already, but please read the associated documentation:
Performance, specifically: Post-Secondary Preparation
Directions
Create a new Google spreadsheet (which you will share with me.)
Download the following SQLite database:
http://stash.padjo.org/data/cdeschools.sqlite
It should have 3 tables:
act- ACT performance by school for 2013-2014, 2014-2015, 2015-2016sat- SAT performance by school for 2013-2014, 2014-2015, 2015-2016frpm- Free/reduced lunch participation by school, 2015-2016
Then:
1. Show the correlation between ACT and SAT performance
Write the SQL query that joins the act and sat so that each school’s corresponding sat.PctGE1500 and act.PctGE21` fields for the ``year of ‘2015-2016’ is lined up.
Additionally, use WHERE to filter by these conditions:
sat.NumTstTakris greater than50(to include only schools that had 50+ SAT takers)act.NumTstTakris greater than50
And besides the two columns of suspected correlation, include for each school:
- the school’s CDS code
- the school’s county
- the school’s district
- the school’s name
Your result should have 740 rows.
Then, export the result as CSV and import into your Google Spreadsheet, which should look like this:
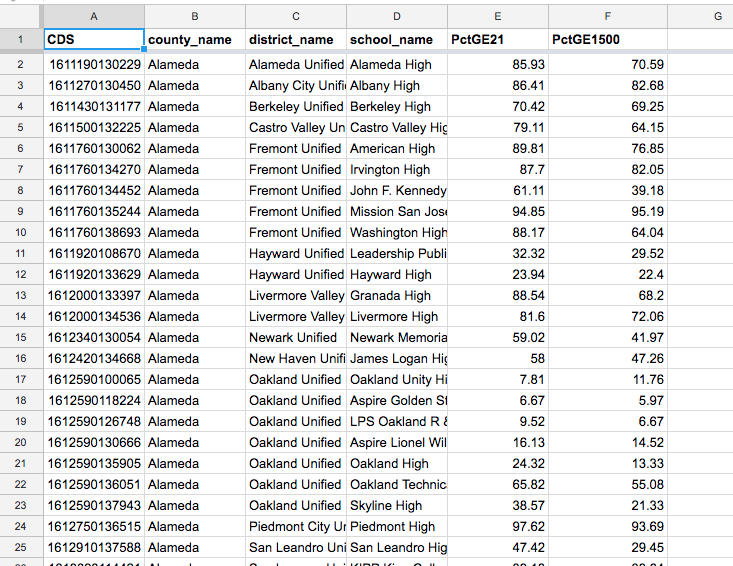
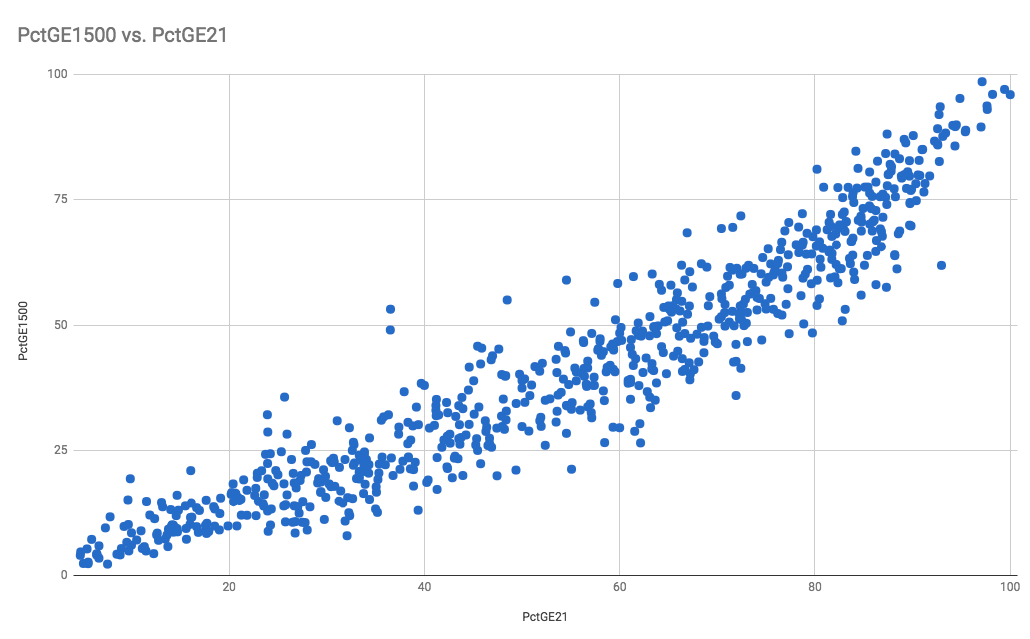
Then make a scatterplot chart to show the correlation of a school’s percentage of SAT takers scoring 1500+ versus its percentage of ACT takers scoring 21+ (have the SAT metric be on the y-axis):
2. Show the correlation between SAT performance and impoverished students
A school’s eligibility for free-and-reduced-lunch is used as a proxy to determine student poverty. Do a JOIN similar to the previous problem except do it between sat and frpm.
We want to show the correlation between a school’s 2015-2016 values for PctGE1500 and for Percent (%) Eligible Free (K-12) (percentage of K-12 students eligible for free lunches)
Additionally, use WHERE to filter by this condition: sat.NumTstTakr is greater than 50
And besides the two columns of suspected correlation, include for each school:
- the school’s CDS code
- the school’s county
- the school’s district
- the school’s name
Your result should have 1033 rows.
Then, export the result as CSV and import into your Google Spreadsheet, which should look like this:
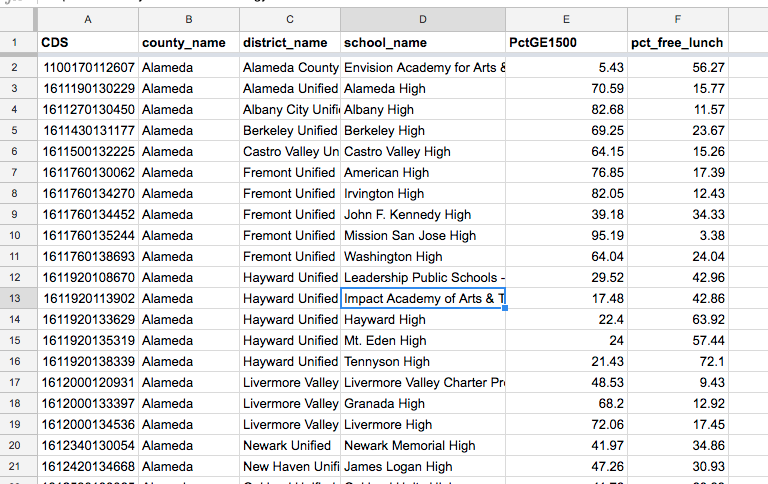
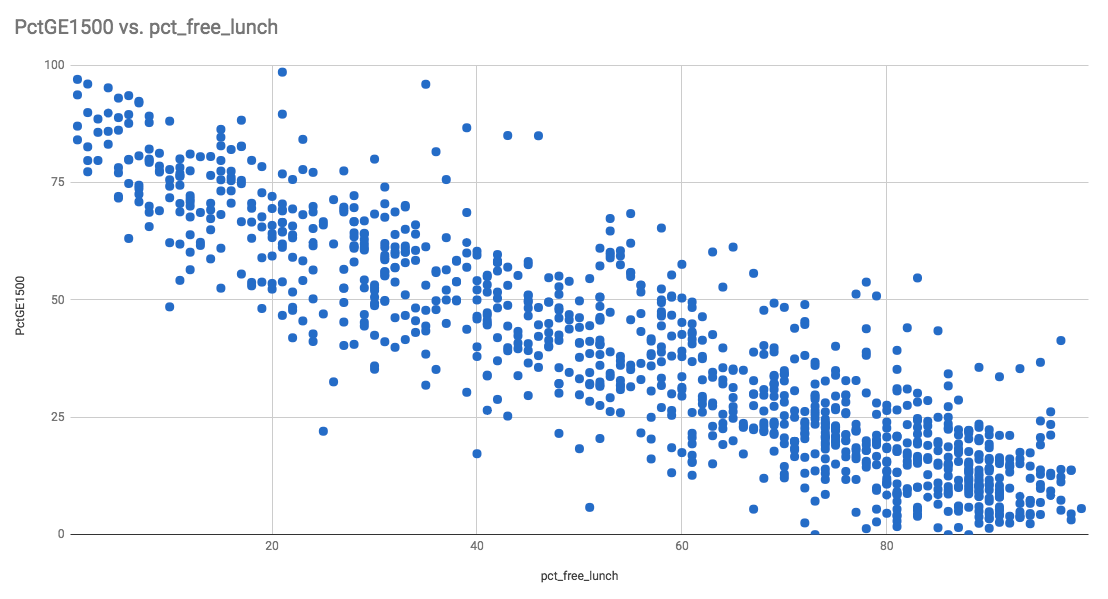
Then make a scatterplot chart to plot the percentage of a school’s SAT-taking students who achieved at least 1,500, versus the percentage of a school’s population that qualifies for free or reduced lunches. It should look like this:
Hints
Starting out
Before you get into writing the actual join, make sure you can write the SQL for this query:
Select the CDS code, the county name, the district name, the school name, and the PctGE1500 field for all schools that had at least 50 test takers in the year ‘2015-2016’.
Do not worry about the JOIN clause until the above SELECT query is working as expected…
How to reference names by table
In particular, when joining the act and sat tables, you might run into an issue of ambiguous column names, as both tables share similar column names. Use the dot operator in order to specify table name and column, e.g.
SELECT sat.cds, sat.NumTstTakr
FROM sat;
How to reference identifiers with non-alphanumeric characters
The frpm table has a few columns that have spaces and other non-alphanumeric characters in them. Use quotation marks to reference these columns:
SELECT frpm."County Name"
FROM frpm;
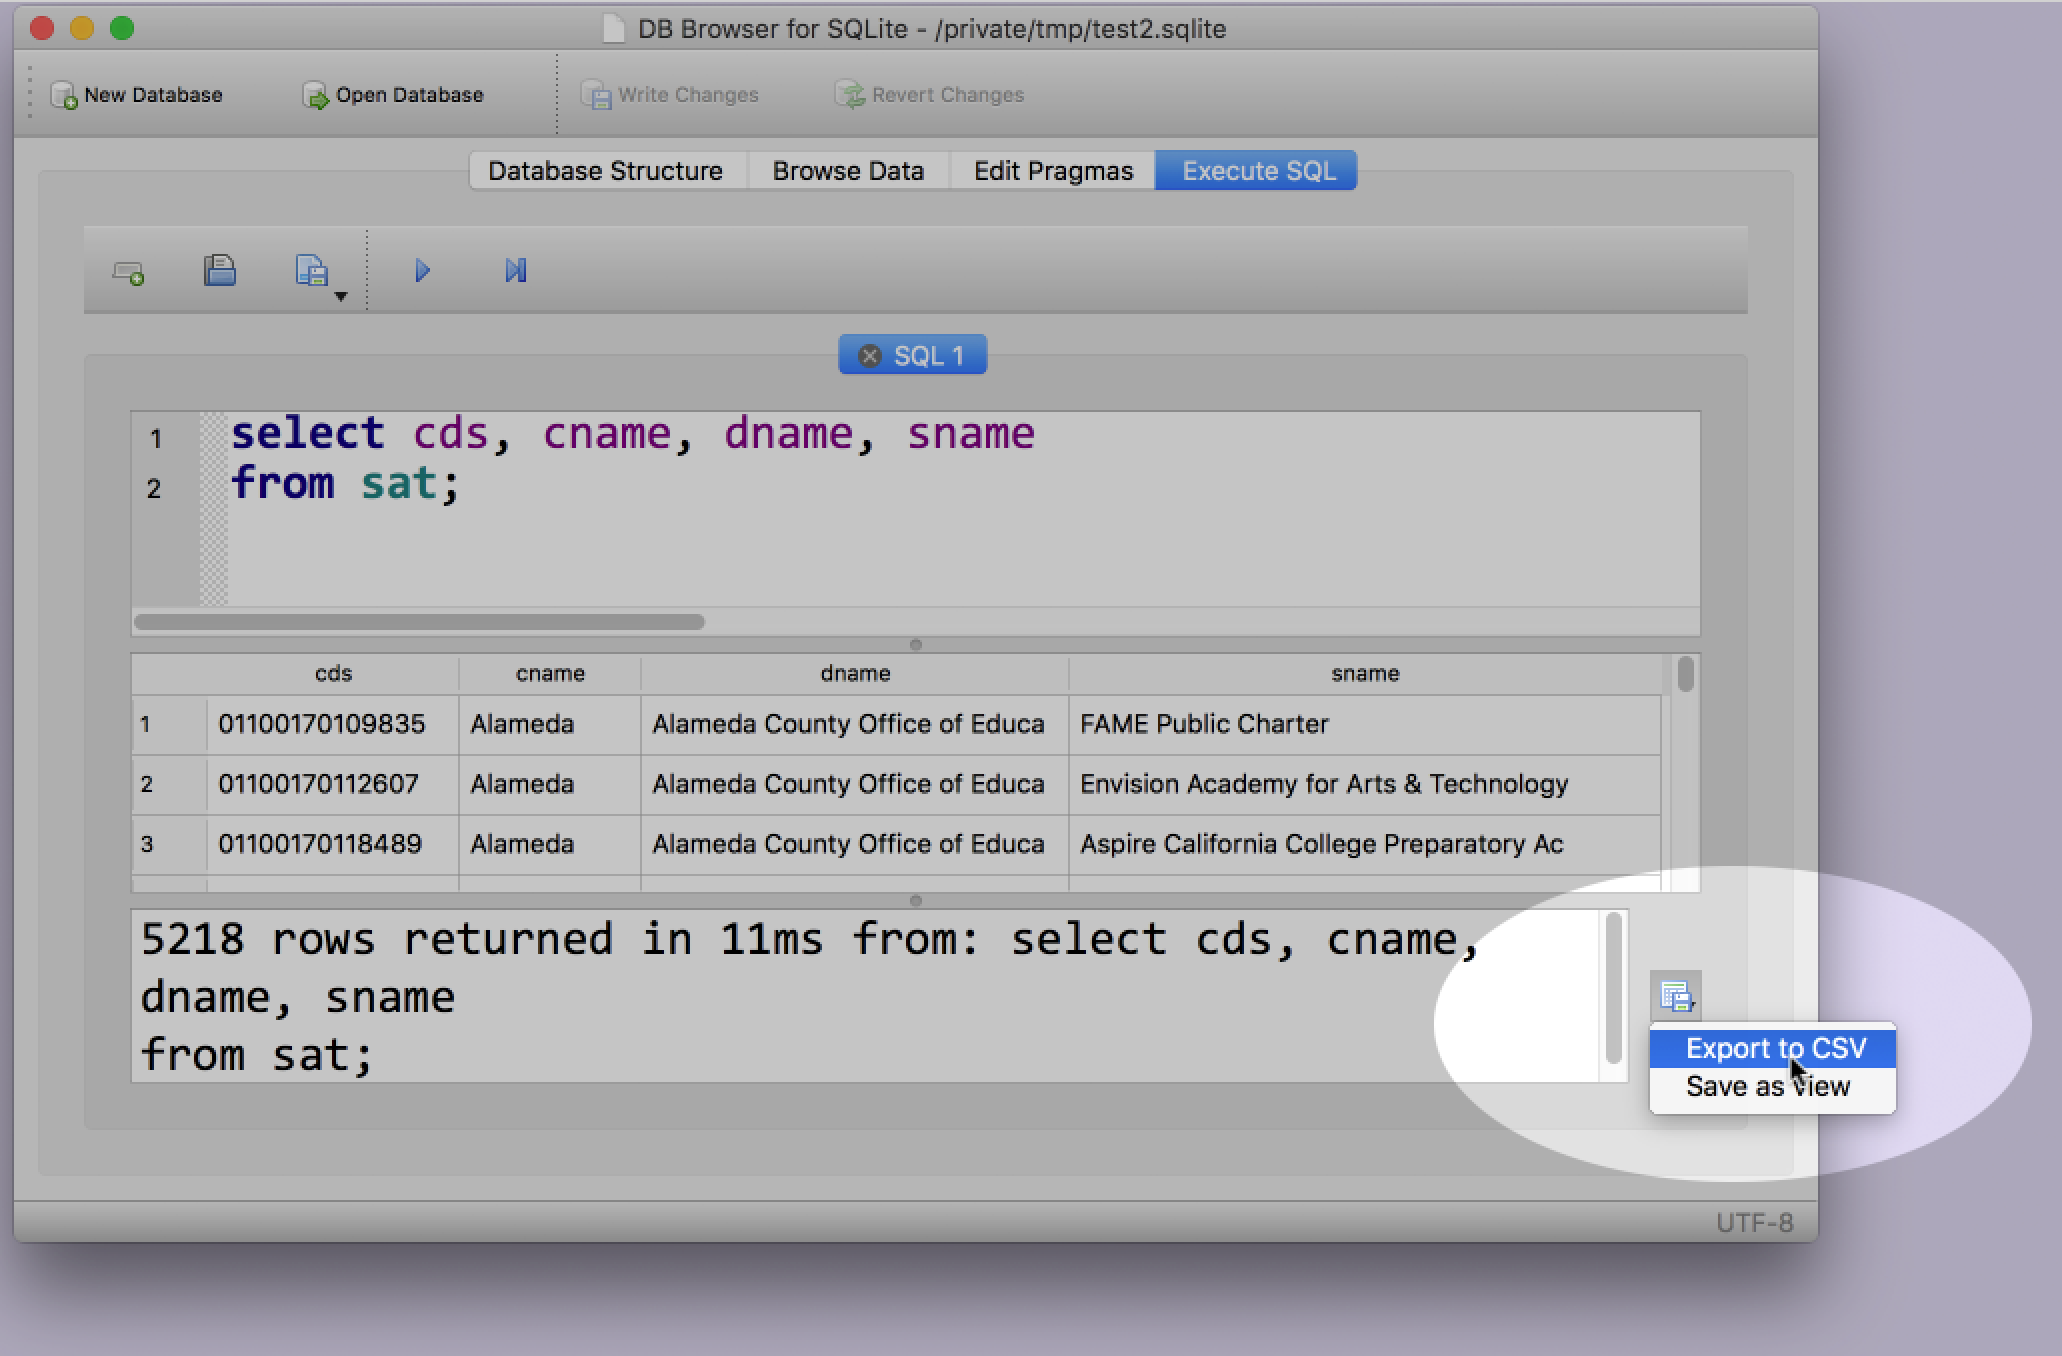
How to export data from DB Browser
This command is not in the menu, but rather, designated to a tiny button that appears in the Execute SQL tab:
How to concatenate strings
SQLite doesn’t have a concatenate function, instead, use the double-pipe as a way of “adding” strings together:
SELECT
    cname || ' ' || sname
FROM sat;
Concatenating strings is needed to create a CDS-like value in the frpm table, in order to join it to the sat table.
Answers to SQL joins on CA schools
1. Show the correlation between ACT and SAT performance
SELECT
    sat.cds
    , sat.cname AS county_name
    , sat.dname AS district_name
    , sat.sname AS school_name
    , act.PctGE21
    , sat.PctGE1500
FROM
  sat
INNER JOIN
  act ON
    sat.cds = act.cds
    AND sat.year = act.year
WHERE sat.year = '2015-2016'
    AND sat.NumTstTakr > 50
    AND act.NumTstTakr > 50;
Elaboration
This is a pretty straightforward join. One thing that hung up a few students – and it’s something I screwed up when thinking out the problem – was that the JOIN condition needed to be more complex than:
INNER JOIN
  act ON
    sat.cds = act.cds
This is because for every school (i.e. cds value), there are 3 possible records in each of the sat and act databases – because there is data for 3 years. It is necessary to specify that act and sat be joined on the cds code and year, so that, for example, the 2015-2016 SAT results for Palo Alto High are matched with the 2015-2016 ACT results for Palo Alto High.
INNER JOIN
  act ON
    sat.cds = act.cds
    AND sat.year = act.year
WHERE sat.year = '2015-2016'
Alternatively, you should specify this logic more literally to the same effect:
INNER JOIN
  act ON
    sat.cds = act.cds
    AND sat.year = '2015-2016'
    AND act.year = '2015-2016'
– just as long as you realize that you’re not technically asking for the same thing, logically – it just happens that the desired results are the same…
2. Show the correlation between SAT performance and impoverished students
SELECT
  sat.cds
  , sat.cname AS county_name
  , sat.dname AS district_name
  , sat.sname AS school_name
  , ROUND(frpm."Percent (%) Eligible Free (K-12)", 2)
     AS pct_free
  , sat.PctGE1500
FROM
  sat
INNER JOIN frpm
  ON
     sat.cds = (frpm."County Code"
                 || frpm."District Code"
                 || frpm."School Code")

WHERE sat.year = '2015-2016'
  AND frpm."Academic Year" = '2015-2016'
  AND sat.NumTstTakr > 50;
Elaboration
The main tactic here is to understand that different tables (maintained by different owners) will have different ways of naming and organizing the data. This problem is one such example: the sat data has a single CDS field, whereas frpm splits it into 3 different fields. Why? Who knows? Likely both of those departments don’t often have much reason to join their data together.
The upshot is that: just by joining these two datasets, we might be doing an analysis that is relatively novel, or at least infrequent. The upshot to that upshot is that we have to deal with this mundane problem in an efficient way.
While the JOIN ON isn’t as simple as comparing 2 fields, the logic is pretty simple. We just have to be able to see how frpm’s fields correlate to sat’s.
Start off with a test query with an expected answer:
SELECT
  sat.sname, sat.cds
FROM sat
WHERE sat.sname LIKE 'Palo Alto High'
LIMIT 1;


SELECT
  frpm."School Name",
  frpm."County Code",
  frpm."District Code",
  frpm."School Code"
FROM frpm
WHERE frpm."School Name" LIKE 'Palo Alto High'
LIMIT 1;
Then put together the concepts:
SELECT
  frpm."School Name",
  frpm."County Code" ||
  frpm."District Code" ||
  frpm."School Code"
FROM frpm
WHERE frpm."School Name" LIKE 'Palo Alto High'
LIMIT 1;
Other questions
Why not join on school name?
Some people tried what they thought was the most straightforward thing to join these tables on, which would be school name:
SELECT
  sat.cds
  , sat.cname AS county_name
  , sat.dname AS district_name
  , sat.sname AS sat_school_name
  , frpm."School Name" AS frpm_school_name
FROM
  sat
INNER JOIN frpm
  ON
     sat.sname = frpm."School Name"

WHERE sat.year = '2015-2016';
But that’s your problem – thinking things are straightforward like they are in “real” life. But in database-world, these assumptions cannot be made:
- That two different schools may have the exact same name (how many schools named after Washington or Lincoln?)
- That 2 different datasets may spell names differently
Case in point, here are 2 examples in which the school name differs across not just sat and frpm, but sat and act (the latter which I did not expect):
SELECT
  sat.cds
  , act.sname AS act_school_name
  , sat.sname AS sat_school_name
  , frpm."School Name" AS frpm_school_name
FROM sat

INNER JOIN act
    ON act.cds = sat.cds
    AND act.year = sat.year

INNER JOIN frpm
    ON sat.cds = (frpm."County Code"
                 || frpm."District Code"
                 || frpm."School Code")

WHERE
    sat.year = '2015-2016'
    AND sat.cds IN ('01612596114011', '37683380107102');
Results from those 2 specific CDS. It’s hard to tell, but it’s in the white space:
| cds | act_school_name | sat_school_name | frpm_school_name |
| 01612596114011 | Independent Study,Sojourner Truth | Independent Study, Sojourner Truth | Independent Study, Sojourner Truth |
| 37683380107102 | Kearny Eng,Innov & Design | Kearny Eng, Innov & Design | Kearny Eng, Innov & Design |
Bonus question: How to find schools with un-matching names?
As an example of how you are free to JOIN on whatever you want, the query below JOINs rows only when there is a mismatch in names:
SELECT
  sat.cds
  , act.sname AS act_school_name
  , sat.sname AS sat_school_name
  , frpm."School Name" AS frpm_school_name
FROM sat

INNER JOIN act
    ON act.cds = sat.cds
        AND act.year = sat.year
        AND act.sname != sat.sname

INNER JOIN frpm
    ON sat.cds = (frpm."County Code"
                 || frpm."District Code"
                 || frpm."School Code")

       AND frpm."School Name" != sat.sname
       AND frpm."School Name" != act.sname

WHERE
    sat.year = '2015-2016';
Visualization isn’t everything
If you think that what we did in this exercise could probably be done in spreadsheets/pivot tables – maybe, though I’m racking my brains thinking about it.
But if you think what we did was not that impressive, you’re right: none of those scatterplot correlations showed anything that wasn’t obvious, e.g. schools that do well in ACTs do well in SATs; schools that are poor do poorly on SATs.
But don’t see database skills as just being visualizations. See them as a way to quickly find stories.
Look at the outliers in this chart:
What if instead of making a chart, we decided to focus on outliers, and to write stories on them?
Other queries
Which schools did the best in math versus writing in SATs?
select
  cname,
  dname,
  sname,
  avgscrmath,
  avgscrwrite,
  avgscrmath - avgscrwrite AS math_diff
FROM sat
WHERE year = '2015-2016'
ORDER BY math_diff DESC
LIMIT 20;
(might need to refine it)
Is it rarer for schools to do much better in writing vs math, than the other way around?
Need to do categorization:
SELECT
  cname,
  dname,
  sname,
  CASE
    WHEN avgscrmath - avgscrwrite > 50 THEN '+50 math'
    WHEN avgscrmath - avgscrwrite > 20 THEN '+20 math'
    WHEN avgscrwrite - avgscrmath > 50 THEN '+50 write'
    WHEN avgscrwrite - avgscrmath > 20 THEN '+20 write'
  END AS schooltype,
COUNT(*) AS schoolcount
FROM
  sat
WHERE
  year = '2015-2016'
GROUP BY schooltype;
Write a query that would put Palo Alto Unified in the best light
(requires an aggregation)
Example: Rank districts by number of good performers
SELECT
  cname AS county,
  dname AS district,
  SUM(NumGE1500) AS good_performers
FROM
  sat
WHERE year = '2015-2016'
GROUP BY
  cname, dname
ORDER BY
  good_performers DESC;