CA’s Autonomous Traffic Accident Reports [2017-10-02]
Attention
- Description
- Counting what we find interesting in the CA DMV’s autonomous vehicle accident reports.
- Due
- 2017-10-02 23:59PM
- Slugline
padjo-2017 homework OL-316-anecdotes your_sunet_id
Send an email with your Google Sheet attached.
The body of the email should have a short paragraph about the 2 data attributes you chose to record.
Also, try to give your sheet read-permissions to dun@stanford.edu via Google Drive.
Background
If you want to test self-driving cars in California, there’s a whole set of regulations and paperwork that CA’s Department of Motor Vehicles requires of you:
CA DMV Homepage for Deployment of Autonomous Vehicles for Public Operation
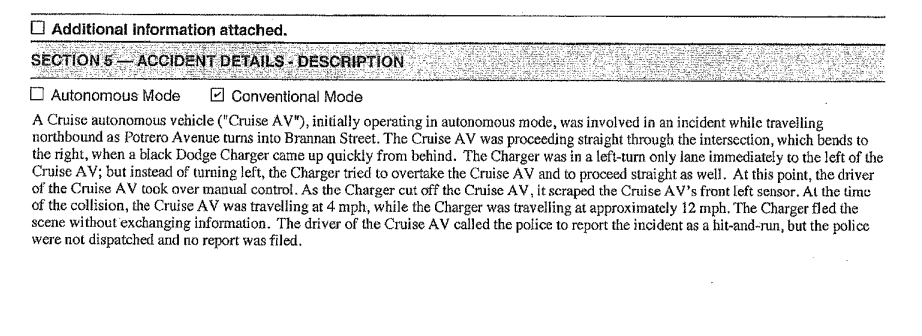
The records of most interest to the general public are probably the OL 316 forms, which self-driving car companies must fill out when their vehicles are involved in an accident. Here’s a blank version:
https://www.documentcloud.org/documents/4063115-California-DMV-s-OL-316-form-Report-of-Traffic.html
Luckily for us, we don’t have to make a records request to view these reports. The CA DMV has a page that lists each individual report – 38 as of late September 2017:
https://www.dmv.ca.gov/portal/dmv/detail/vr/autonomous/autonomousveh_ol316
Anecdote is the singular of data
Despite what you may have heard, data is indeed the plural of anecdote, at least according to Raymond Wolfinger, the Stanford professor who coined the phrase.
Nate Silver, founder of FiveThirtyEight, referenced this bit of trivia in 538’s launch post, “What the Fox Knows”:
You may have heard the phrase the plural of anecdote is not data. It turns out that this is a misquote. The original aphorism, by the political scientist Ray Wolfinger, was just the opposite: The plural of anecdote is data.
Wolfinger’s formulation makes sense: Data does not have a virgin birth. It comes to us from somewhere. Someone set up a procedure to collect and record it. Sometimes this person is a scientist, but she also could be a journalist.
Among the many takeaways: data requires a concerted effort and initiative to collect, because it is always a pain in the ass. Moreover, the data collection process is inherently a process to standardize – through simplification – the full facts and context of an observation.
And this applies to even the paper and computerized forms used to collect data. From Kathryn Schultz, the history of death certificates, and how exceedingly complex (and political) the circumstances and facts involved in every person’s death:
As that suggests, death certificates, again like tax returns, do not always scrupulously reflect the truth. From the beginning, they have been compromised both by the limits of medical knowledge and by dodgy reporting practices. In 1662, John Graunt complained that syphilis was underreported as a cause of death because medical investigators failed to recognize it “after the mist of a Cup of Ale, and the bribe of a two-grout fee.” Similar treatment befell other causes of death viewed as morally damning or unmentionable in polite company: tuberculosis, breast cancer, alcoholism, aids, suicide. To protect the reputations of the deceased and the sensibilities of survivors, doctors sometimes upgraded those socially awkward deaths to more acceptable ones—issuing, in essence, vanity death certificates. That practice was sufficiently common in nineteen-thirties New York that the city began issuing a confidential medical report of death: a second, separate document stating the real cause of death.
For this exercise, we’ll make our own data collection process on top of an existing data collection process – the DMV’s self-driving accident reports. It’s nice that we can read the reports online, but the DMV’s default view presents only a list and a count of accidents. At most, we can summarize in our heads the number of accidents per year, or by company. But what about the circumstances of the accidents? Or even outliers – such as the “worst” accident?
The bulk of this exercise’s work will seem to be tedious data entry. But it’s also intended to get you to notice the details, and the flaws, behind an existing official process, and to realize that not only is counting important, but that there are many different ways to count the same type of events.
Directions
I’ve made a Google Spreadsheet to serve as a template for this work. You can visit it at this URL:
https://docs.google.com/spreadsheets/d/1DSkIjtt1IzXFnVEAwBbr3g-CNkoln1ne9uGu78Bbio4/edit#gid=0
It should be read-only, so make your own copy of it. This copy is what you’ll fill out on your own and send to me in an email at dun@stanford.edu, with this slugline:
padjo-2017 homework OL-316-anecdotes your_sunet_id
In the body of the email, please write a paragraph or so about what 2 data columns/attributes you chose to record, and why. For example:
My sheet includes a column namedav_last_speed_mph, which refers to the last known speed of the autonomous vehicle before the accident. I thought it’d be useful in seeing which, if any accidents occurred at high speed due to the self-driving AI. And high speeds are a proxy for seriousness of an accident.
Also, try to give your sheet read-permissions to dun@stanford.edu via Google Drive. Going forward, it’s easier when you give me access to files on your Google Drive for this class and just send me a link. But the distinction can be hard to understand, so I’ll make sure we all know how to do it next week.
My template has 3 of the reports logged.
Pick 10 other reports at random from the DMV’s OL-316 list and, following the template I’ve made, fill out the details for each of those reports, eg. the date, time (notice that it’s in ISO/military format), city, operational mode, etc.
Then – this is the hard part – think of 2 new attributes that are worth recording, i.e. 2 new columns to record. When I say “worth” recording, I mean, which attributes, when seen in a table or otherwise visualized, would reveal something interesting about these roughly 40 incidents as a whole?
For example, I created a column av_last_speed_mph, which is short for “autonomous vehicle’s last speed (mph)”. This is not a value that has a specific form field – probably because not all accidents involve a vehicle actually moving. Instead, it was a detail I noticed in some of the narratives:
Maybe you’ve been in a vehicle accident and you can think of some particular aspect about it that was important to remember and even tell someone else (such as your insurance, or the police). These self-driving car accidents are accidents like any other. But you’ll have to read a few narratives before you can see where there might be something that is common enough across all the reports that it is worth counting.
Hints and caveats
Hopefully the data entry won’t be too annoying. But before you start doing it, ask yourself – what is the most important/interesting things to know about any type of vehicular accidents? To the government. To those who are involved. To the public. To the journalists…
Even before you get to the part where you figure out what data attributes to pluck from the reports’ narratives, you’ll notice all kinds of data irregularities in the form’s more structured fields:
- Sometimes date/time info is incomplete
- Other vehicles aren’t said to be involved (in terms of the count of vehicles) if the other vehicles didn’t stop (i.e. a hit and run)
- The autonomous vehicle is sometimes marked as being both stopped and in-motion as part of the accident.
And that’s before you get to the broader questions that no form can really capture, such as:
- Do we consider Waymo the same as Google Auto? Cruise Automation the same as GM Cruise?
- Is there an injury if no one went to the hospital? As far as the report’s author knows?
- Do car accidents always have to involve another car?
Stats vs anecdotes
This is the type of topic for which we would love to make some kind of authoritative calculation, like “Company A had 43% more accidents than Company B”. But be aware that – besides the relatively small number of accident reports in total over 3 years – there are a lot of unknown variables, such as whether Company A has the same self-driving mileage compared to Company B. Or if both companies are even testing the same kind of features and driving conditions. And what about Company C, which may do most of its testing in states that do not require public disclosure?
That’s OK. The intent of this exercise is that we’ll see how taking the time to count the details can reveal interesting facts from even a small dataset of anecdotes.
Last year’s assignment with Google’s PR
Last year, I had a similar assignment. But it looked at the forms that Google (pre-Waymo) itself published. It had mostly the same information, but it being a self-produced report, there were details that were left out that are available in the OL-316 reports.
Here’s the OL-316 report for Google’s February 2016 accident:
And here’s the report they self-published:
It would’ve been a fun meta exercise to catalog the differences between the official DMV reports versus what Google’s PR division published, but that’s probably too meta.
If you want more context to the situation, take a look at last year’s assignment page: