Scoping out the Census Surname Data
Go to the index page for the census-surname lessons:
Learning spreadsheets with Census Surname data
Overview
This is the first in a series of hands-on walkthroughs/lessons on working with data and spreadsheets. The topic is something relatively benign – the frequency of American surnames as collected by the U.S. Census – but the techniques to work with the data are the same as they are for any dataset. At least with surnames, just about everyone has one and can imagine what it might be as “data”.
Introduction to the Census data
The Census has a landing page for their surname data:
https://www.census.gov/data/developers/data-sets/surnames.html
The documentation is also pretty accessible, though even in this slim PDF you’ll learn more than you’ll want about how varied and complex Americans’ last names are:
https://www2.census.gov/topics/genealogy/2010surnames/surnames.pdf
If you want to follow along, you can download the Census data that I’ve uploaded to Google Spreadsheets. These are read-only, but you can make your own copies to alter:
Census 2010 surnames Google Sheet
Census 2000 surnames Google Sheet
Here’s what the workbook looks like:
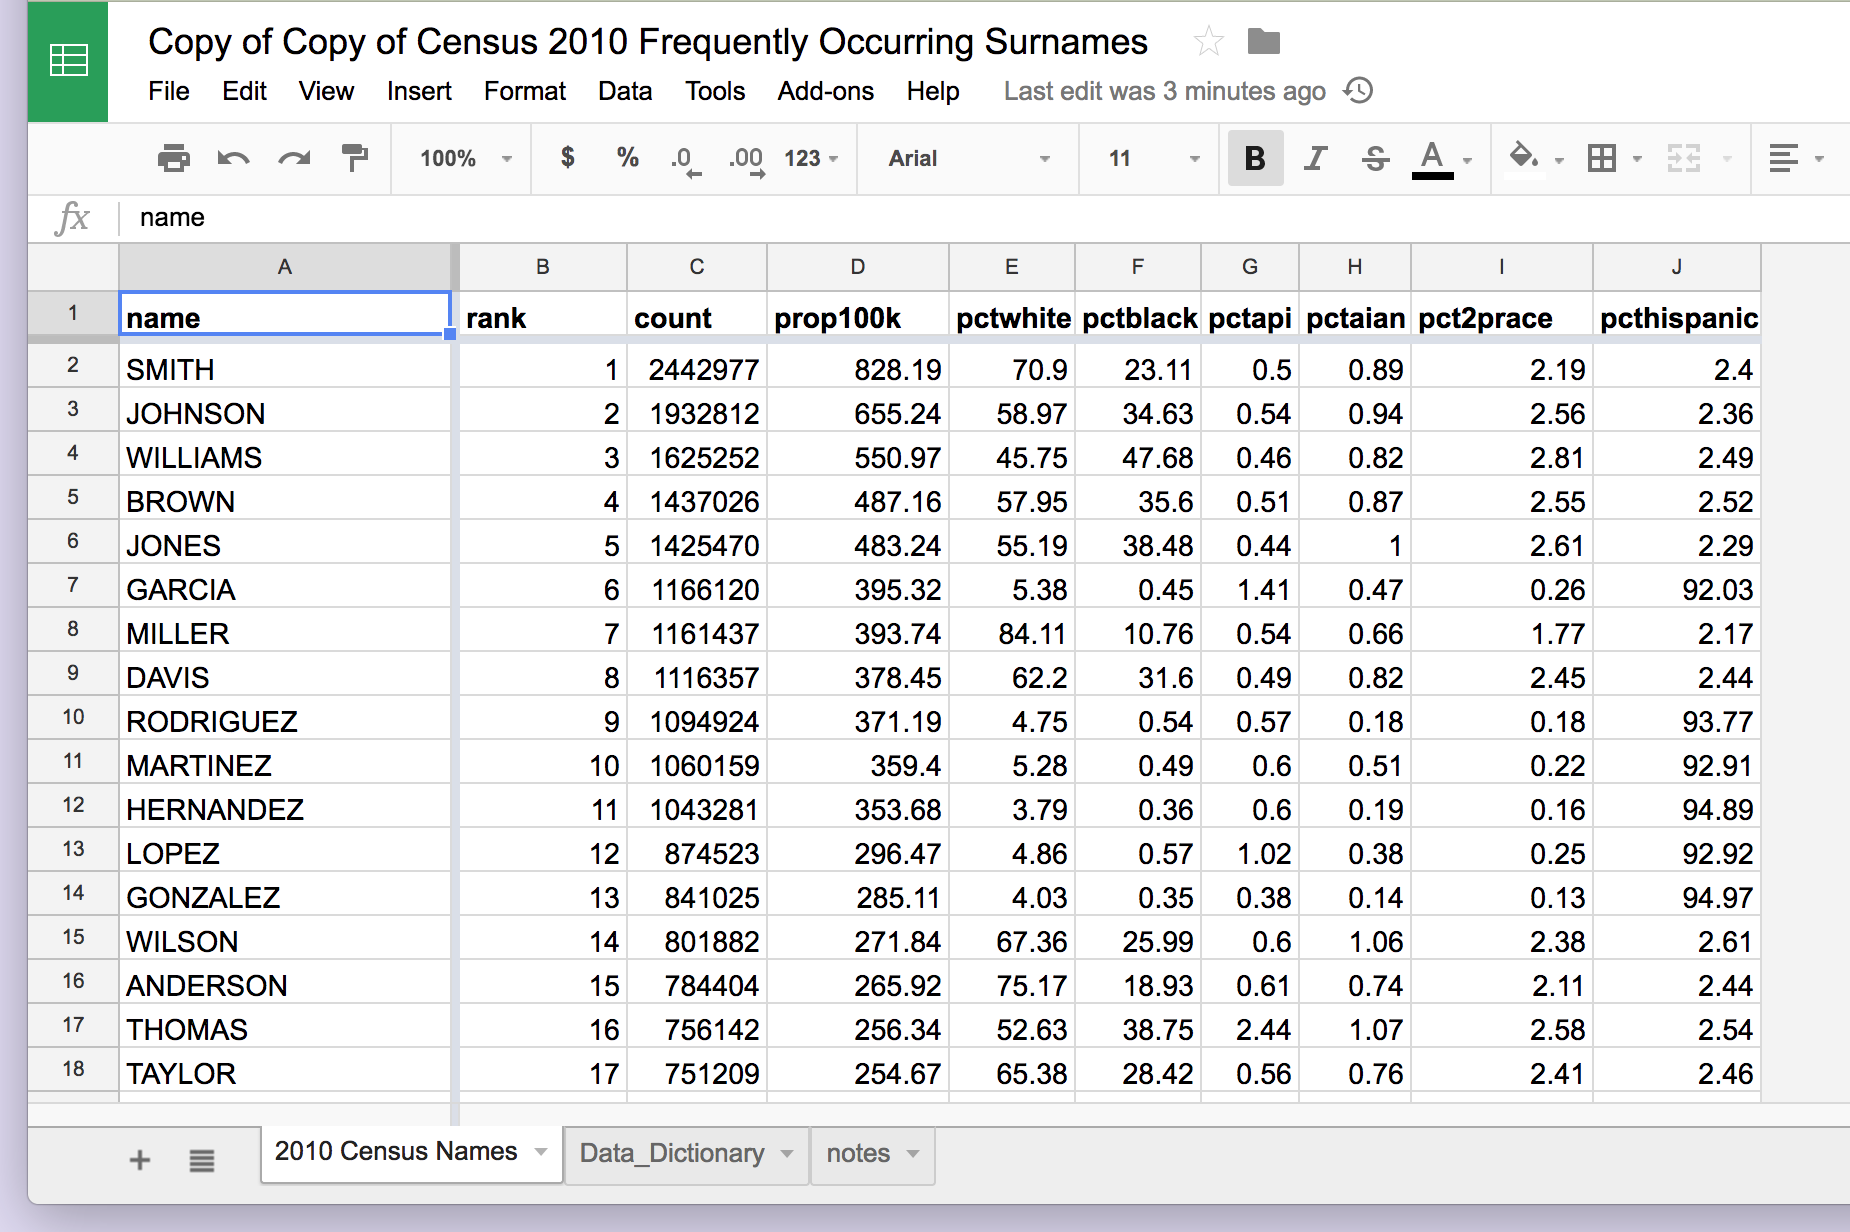
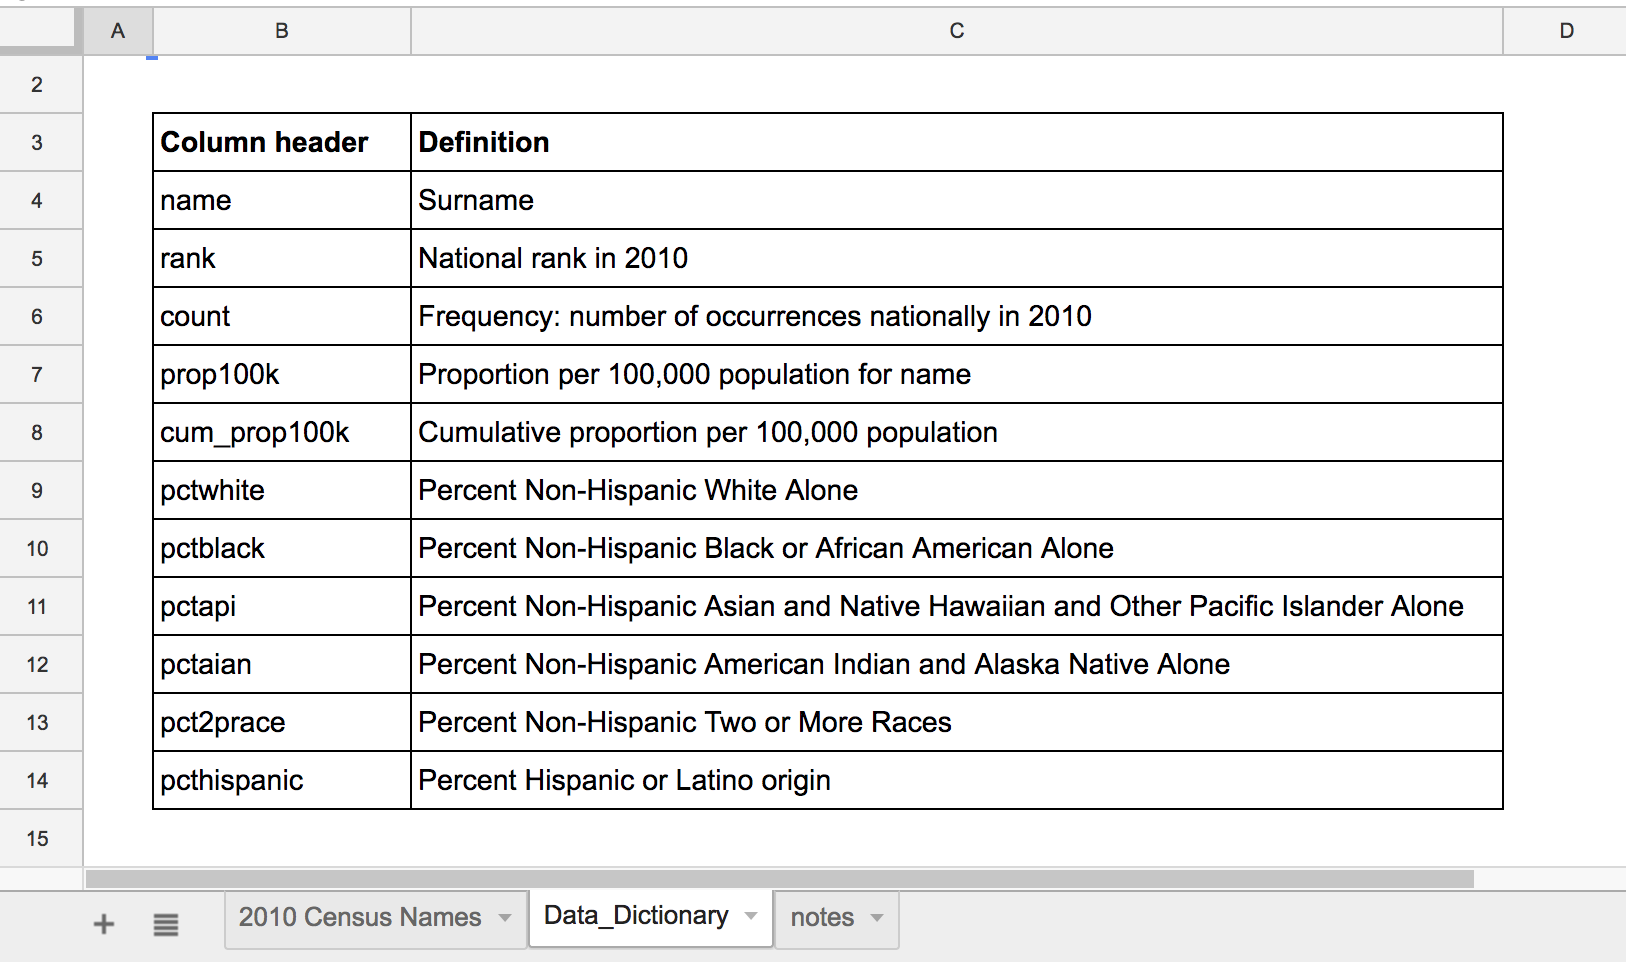
You’ll notice that this workbook has several tabs. The main/default tab has the data. But look at the Data_Dictionary for some insight on what the column names mean:
Note
note
My version of the Census data has one change. I deleted the cum_prop_100k column because I was trying to keep the file size down. We’ll see later how to recalculate that number.
Finding the boundaries
Let’s pretend the Census didn’t provide copious documentation for their data releases. With any dataset, your first question should be: how much data is there?
Download it for yourself
Even though this lesson uses Google Drive, which stores files and data in the “cloud”, you can always download copies of the data to store on your own machine.
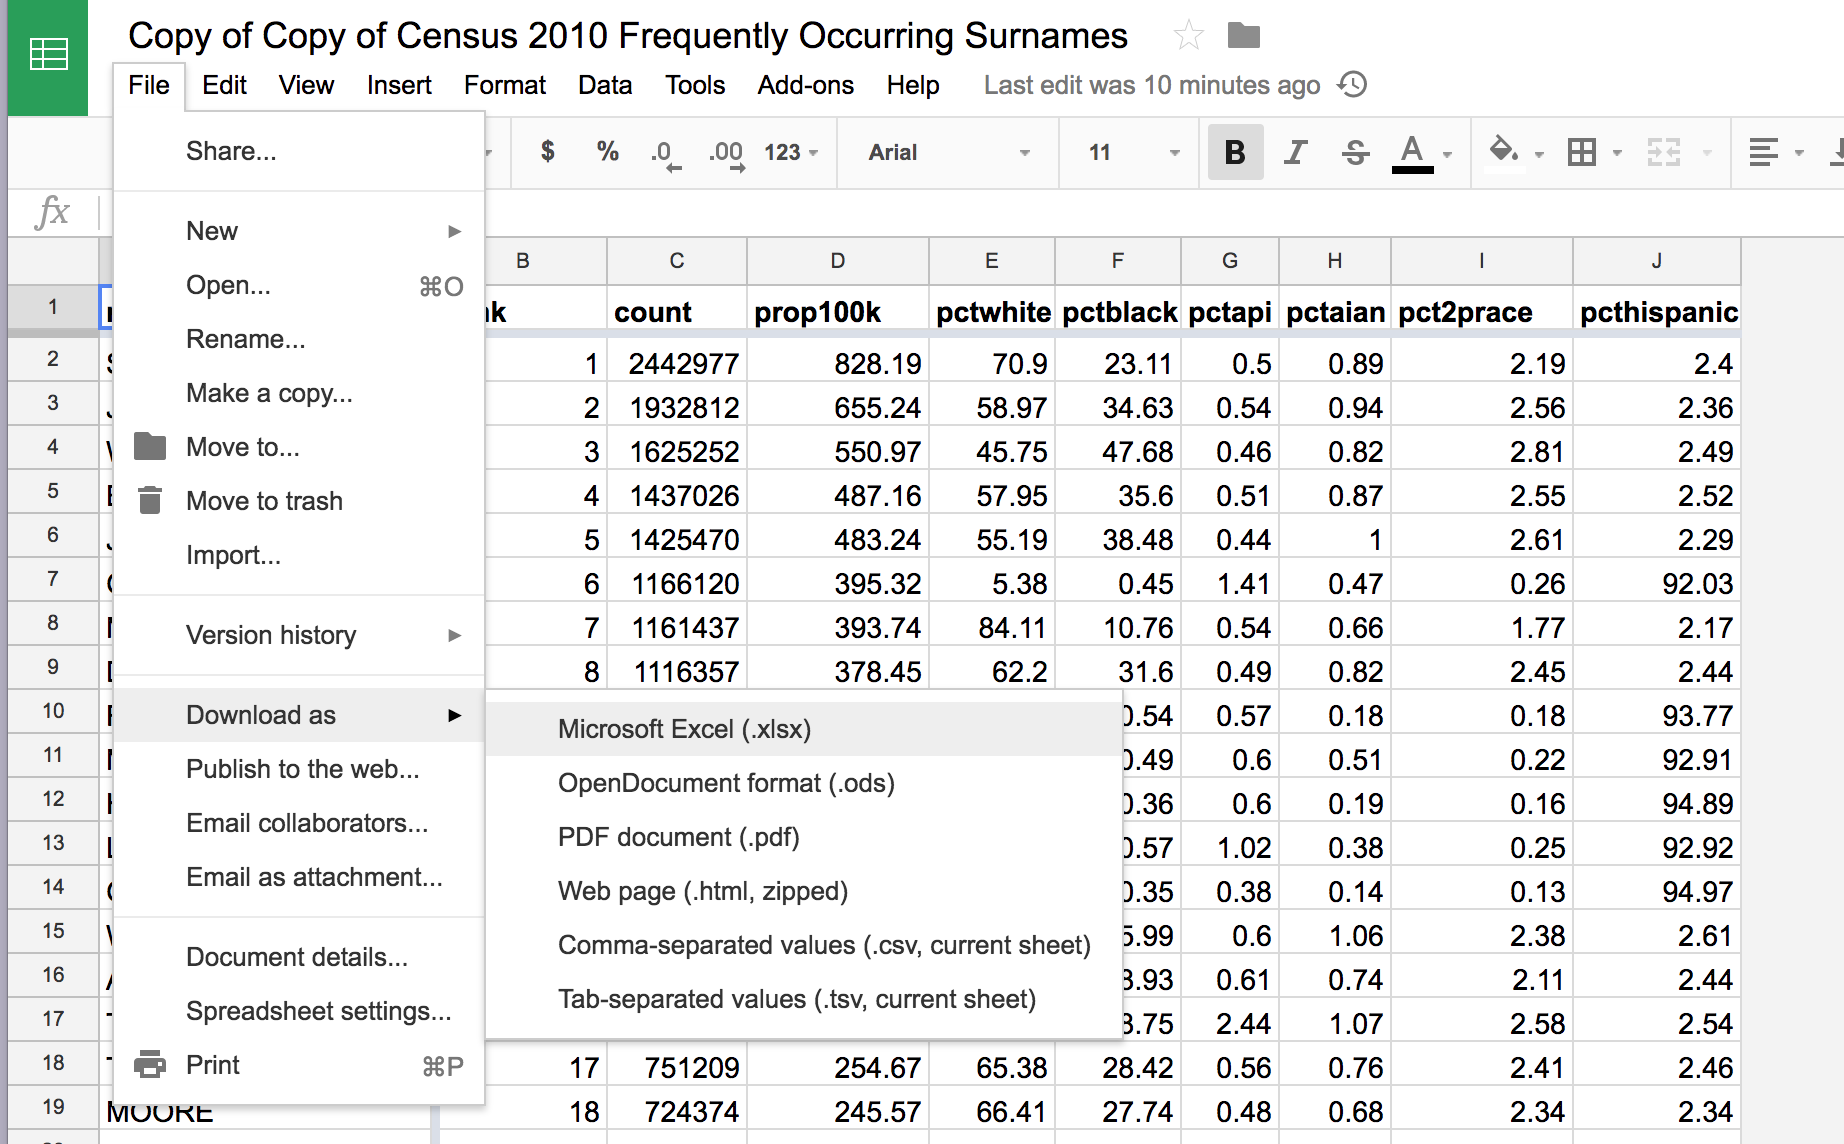
Go to the File menu, and then select the Download as > Microsoft Excel action to download an Excel-compatible version:
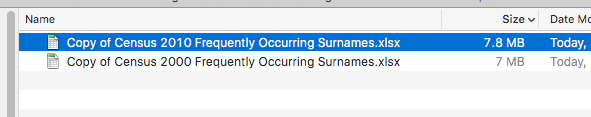
Downloading the two spreadsheets will at least reveal their file sizes, which generally correlates with the amount of data stored.
How many rows are there?
In a standard dataset, the number of rows will represent the number of observations contained in the dataset. In our example, every row represents an American last name, how many people have that last name, and the ethnic/racial makeup of that group. In other words, the number of rows in this spreadsheet is a rough approximation of all the last names recorded during the work of the Census.
Usually if I’m exploring a dataset for the first time, I’ll explore it the old-fashioned and clumsy way. Just use my mouse to scroll to the bottom of the spreadsheet. I don’t always recommend doing this. Depending on the size of the spreadsheet, its structure, the speed of your computer (and web browser), point-and-clicking/dragging your way through a large spreadsheet can be aggravating and prone to error.
However, one benefit of this casual, manual exploration is that the bottom of a spreadsheet literally represents the end of its data, the extremities of the possible values. This is where you’ll often see unexpected or incomplete records.
Case in point: Tthe Census surname data appears to be sorted by the rank column – a rank of 1 representing the most common surname. So it seems logical the very last row to be the least common surname:
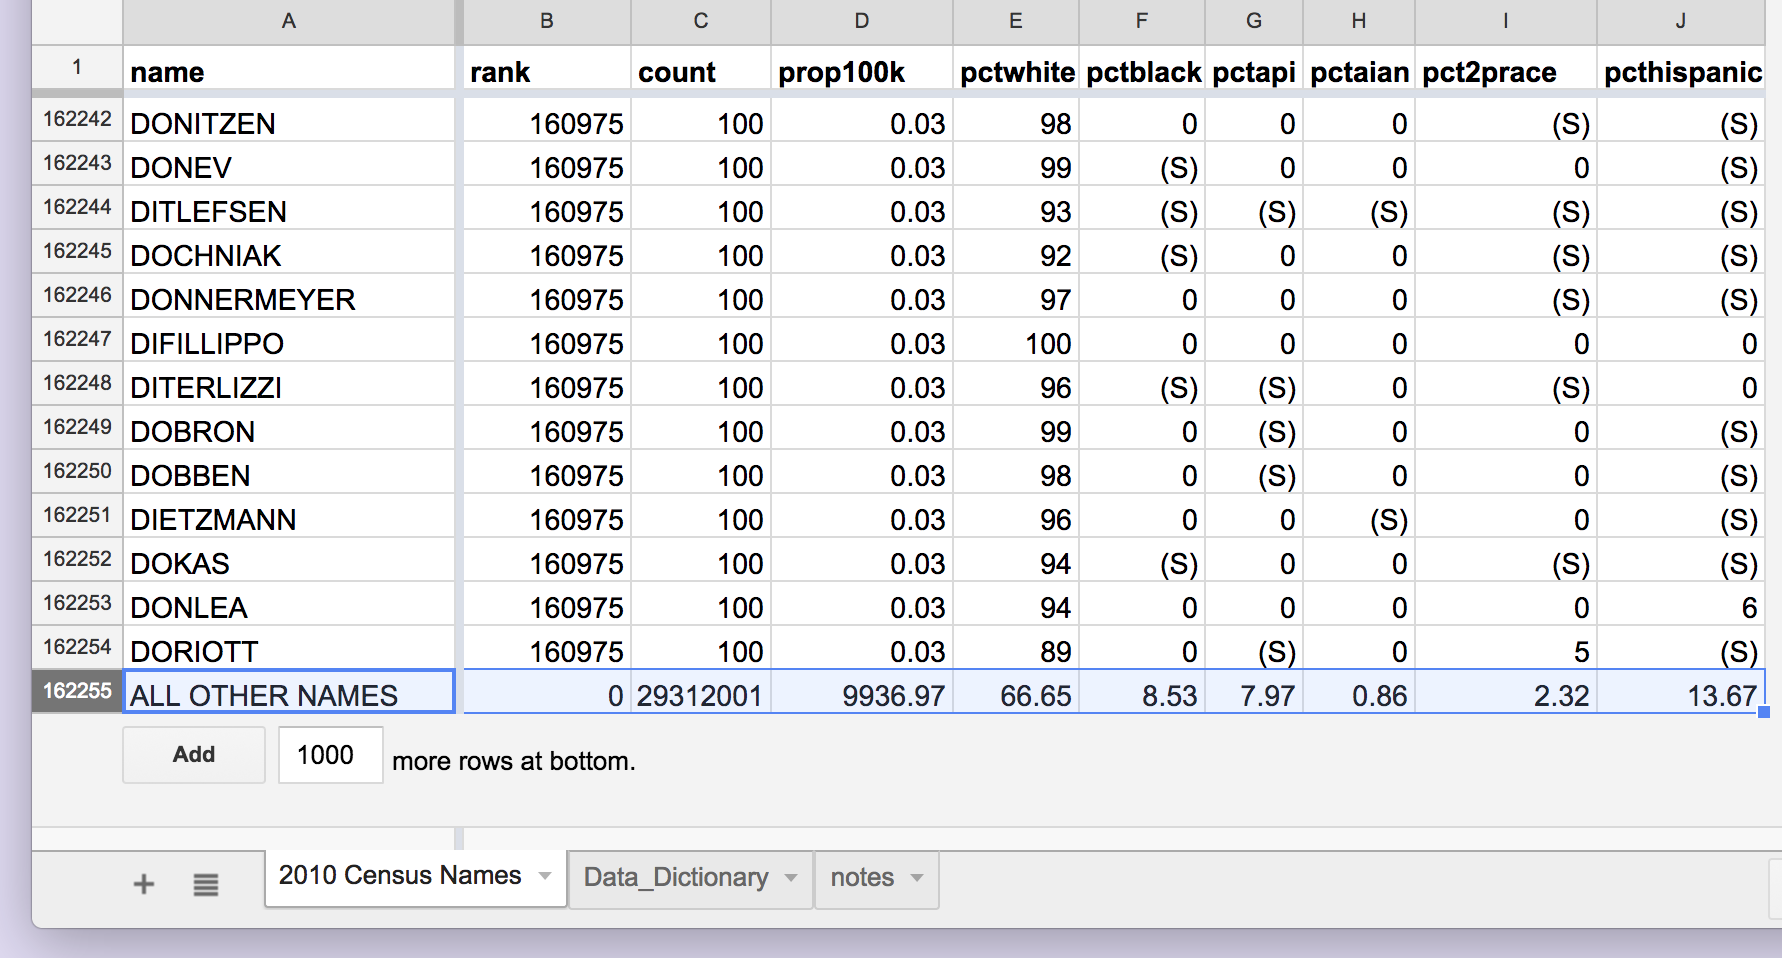
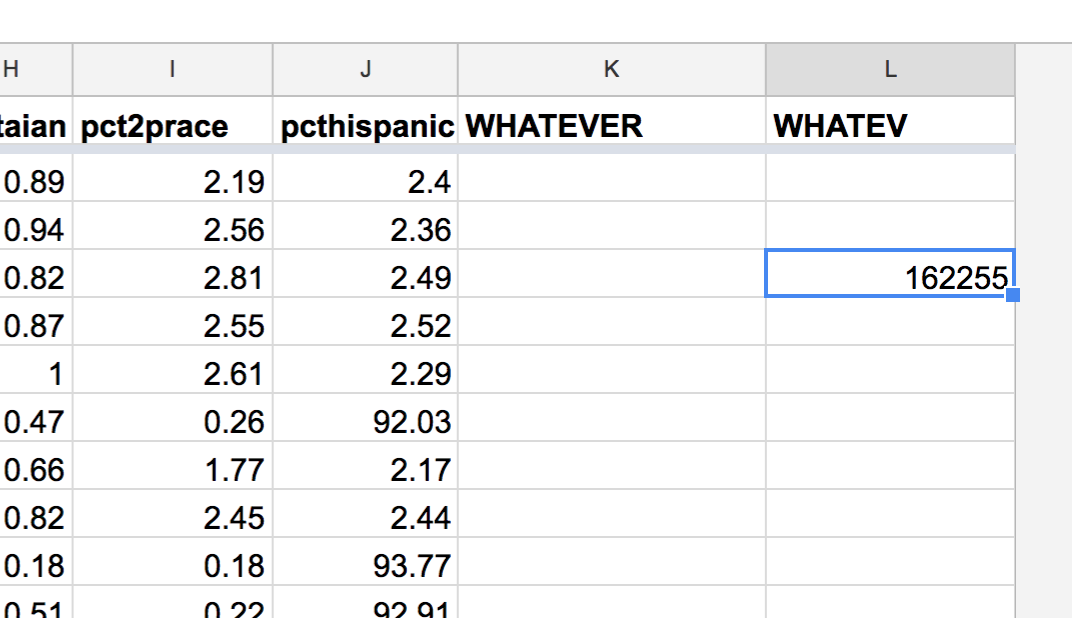
But that’s not the case. The Census has decided to use the very last row – row 162,255 – to store an aggregated data point. Not for a single last name, but ALL OTHER NAMES – all the last names that occurred fewer than 100 times in the Census data-collection.
You’ll also notice that many of the least-frequent last names of the text value of (S) in their cells, which signifies that the actual value – e.g. the pctwhite or pcthispanic“ – has been surpressed for confidentiality reasons. That means any aggregation of these columns has to deal with the fact that not all of the values are numbers.
Napkin-type calculations
A word about how I teach spreadsheets: Spreadsheets can be used in ways as powerful and flexible as any freeform digital canvas.
Some examples:
- Super Mario Bros. re-enactment
- Tracking a hedge fund’s profits and losses
- Efficient online dating
- Role-playing games
- Tracking your co-workers’ salaries
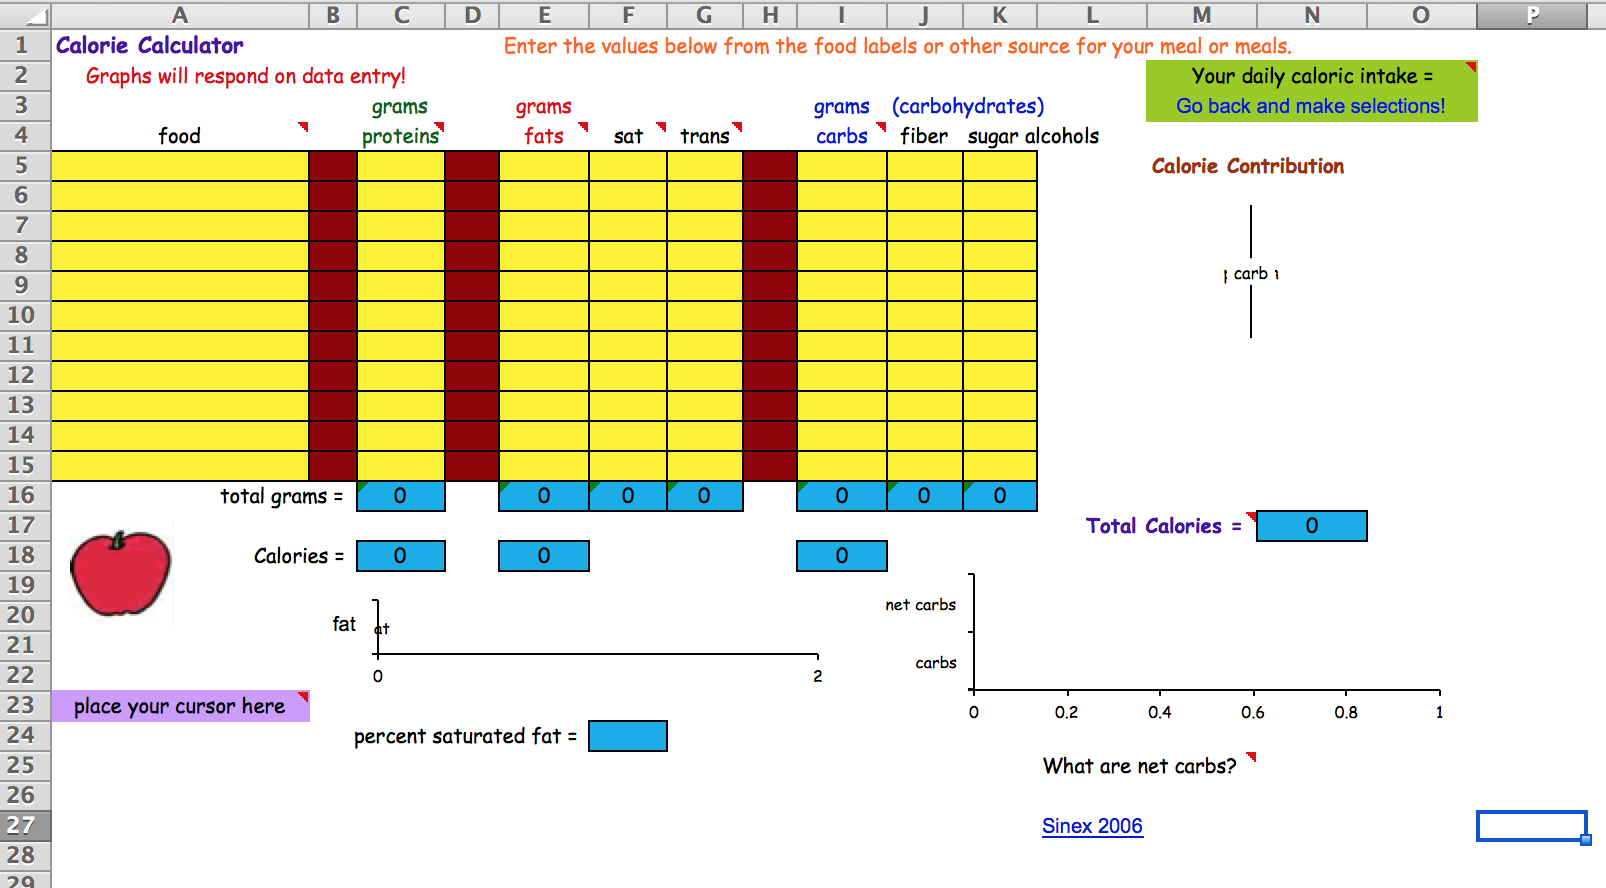
It’s fun to use spreadsheets as interactive calculators, such as this calorie calculator (found in this repository ):
For the purposes of this data journalism class, we try to use spreadsheets in the most uniform (i.e. boring) way possible, in which every row represents a data observation, and every observation follows a prescribed structure. This is because that’s the way things work when using database software, and we’ll be importing/exporting spreadsheets into databases and vice versa.
However, if you’ve learned spreadsheets from another class, you’ve probably learned how any cell in a spreadsheet can be used to do a calculation.
In the 2010 Census surname spreadsheet that I’ve provided as a Google Sheet, I trimmed off any extra rows or columns. But there’s nothing stopping you from adding new empty columns:
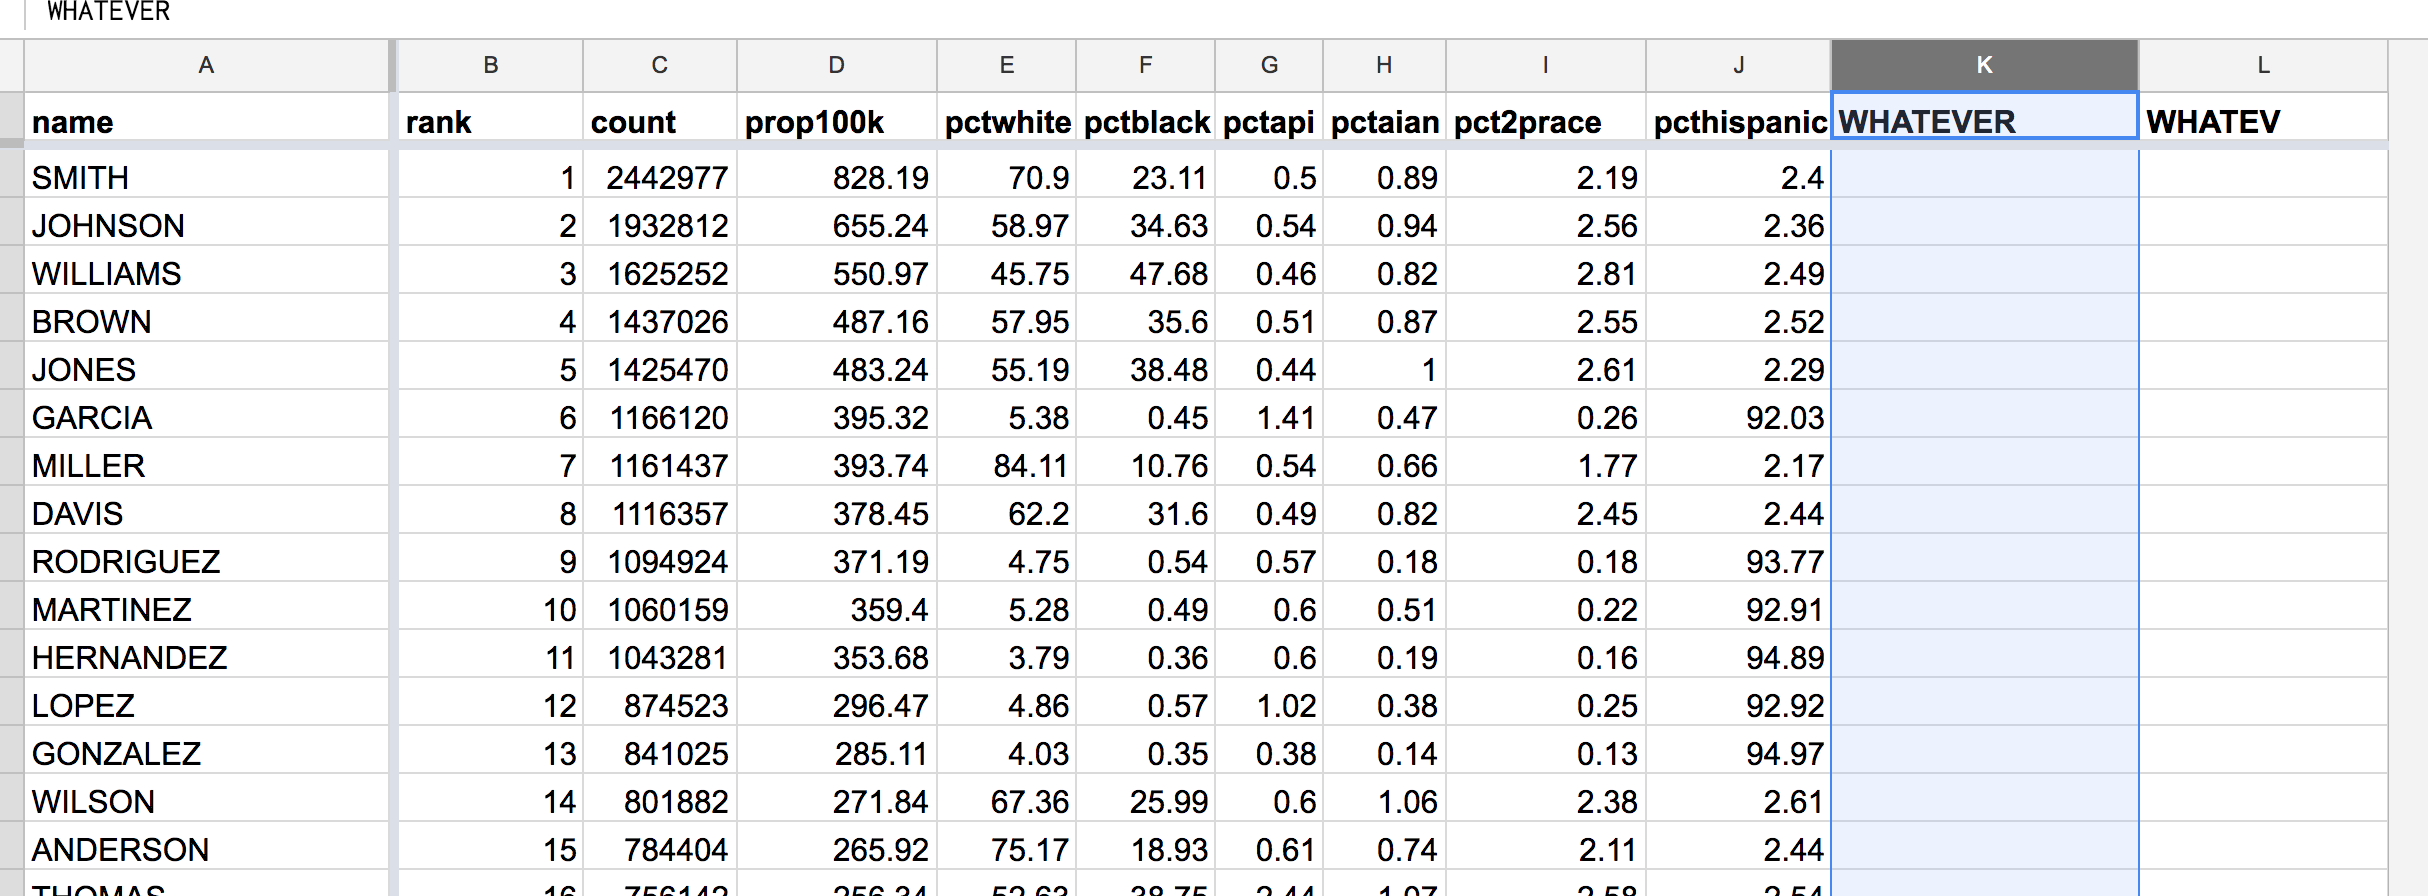
Which gives you empty cells to type in whatever you want. For example, the COUNTA function is used to count “the number of values in a dataset”.
The following formula passes in the entire column of A into the COUNTA function:
=COUNTA(A:A)
I can throw that formula in to an empty cell:
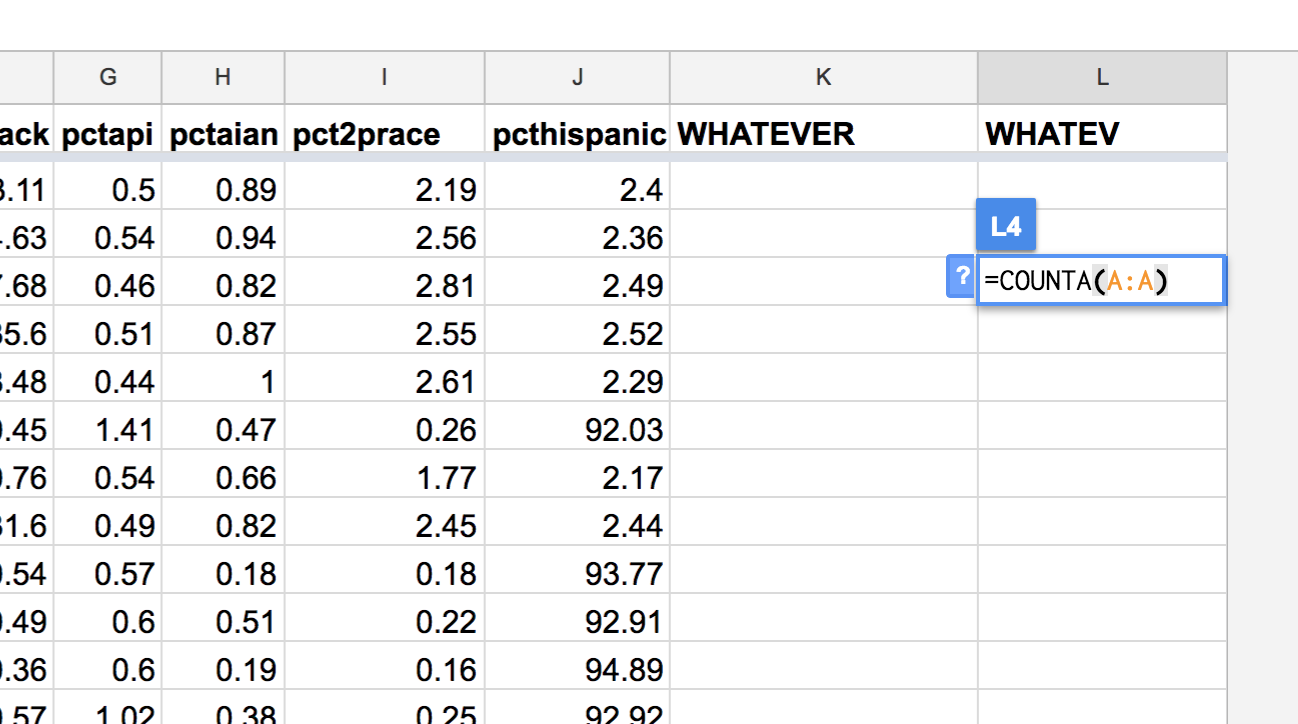
– And I get a numerical result:
As another example, if I wanted to sum up the count values – the column that is labeled C – I could run this formula, which would ostensibly return the total number of Americans with last names (as counted by the Census):
=SUM(C:C)
I call these “napkin calculations” because they’re done on a whim and aren’t meant to co-mingle with the raw data. It’s possible to run these formula in a separate sheet, but I always forget the syntax. In any case, I prefer to do these kinds of aggregations using pivot tables, which we’ll learn in subsequent tutorials.