How to Excerpt the Census Surname data
Go to the index page for the census-surname lessons:
Learning spreadsheets with Census Surname data
Overview
One problem with spreadsheets, particularly Google Sheets and similar browser-based applications, is that their interactive features run into a hard wall when processing huge amounts of data.
The 2000 and 2010 Census surname datasets have about 150,000 rows each, and nearly a dozen columns. This comes out to nearly 1.8 million data cells, or 3.6 million data cells for both the 2000 and 2010 data.
This isn’t “big data” by any means, but it can cause modern spreadsheet to slow to a crawl. This won’t be an issue when we learn how to use SQL databases, but it is definitely an as we try to work with the Census data using Google Sheets.
The key concept is to see this less as a technical/mechanical problem, and more of a problem of information overload. What insights do we anticipate finding in the Census surname data? And do we really need to consider the data for the many, many uncommon American surnames?
How many top surnames represent most Americans
One of the easiest filtering strategies is to just take the “top X percent” of the raw data. We see this approach in many contexts. The Dow Jones and S&P indexes gauge the health of the American economy not by analyzing the data of every public company, but the most prominent companies in the most important sectors.
Likewise, we may not need to include every American surname to do a useful analysis of the Census data. Maybe we just need the top 100 surnames. Or the top 1000? Or the top 10000?
The official 2010 surname spreadsheet from the Census has a column named cum_prop100k, which is supposed to be running tally of how many Americans (out of 100,000) have a surname at a given rank.
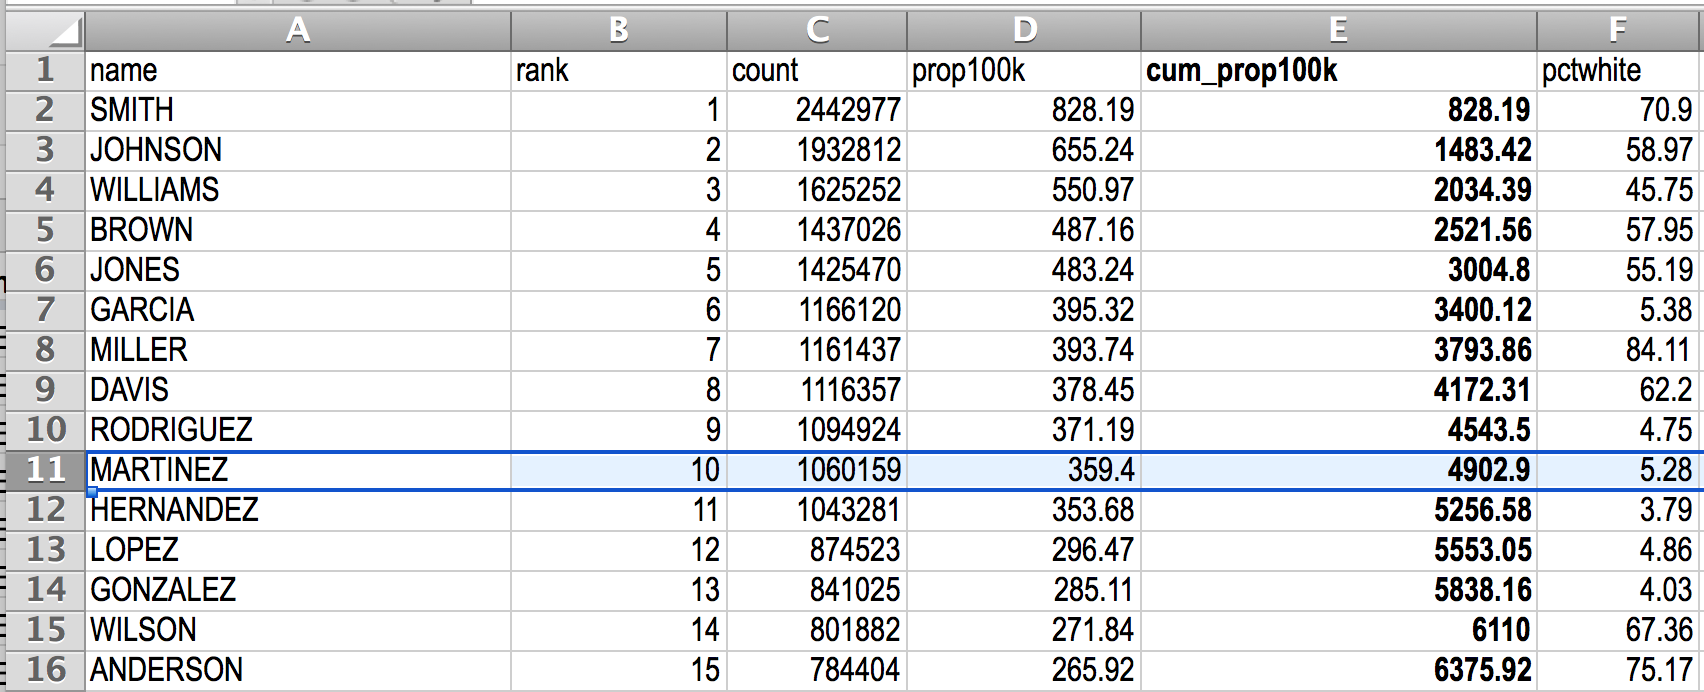
I deleted the cum_prop100k column because it’s not important for our analysis, and I wanted to slim down the file for Google Sheets, but here’s a screenshot of what the original spreadsheet (with emphasis added to the cum_prop100k):
For the 10th ranked name – Martinez – the cum_prop100k value of 4902.9 indicates that 4,900 out of 100,000 Americans have the surname of “Martinez” or the 9 other most common surnames. In other words, an estimated 5 percent of Americans have a surname among the top 10 most common surnames.
Everyone likes the “Top 100” of things. Let’s see how many Americans are approximately represented by the top 100 most common surnames:
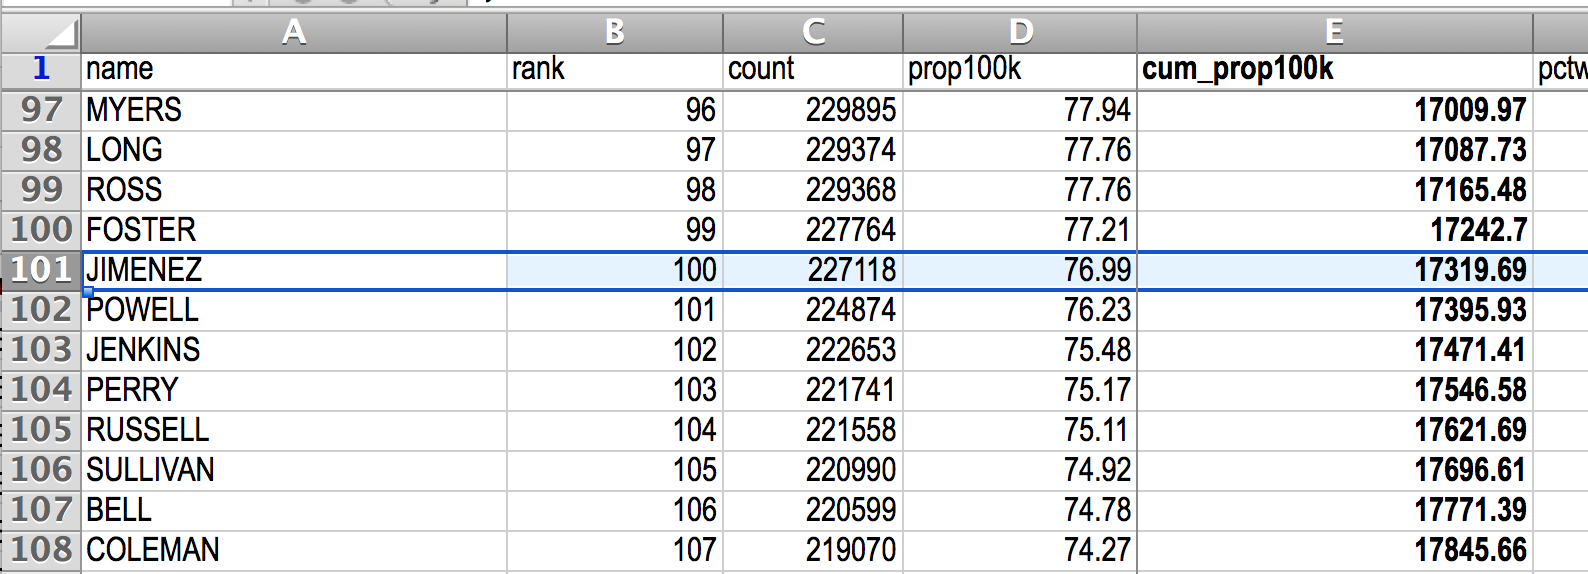
Jimenez is the 100th most popular surname, with a cumulative ratio of 17242.7 per 100K, i.e. roughly 17 percent.
Scrolling down to the top 1000th name, we see ARCHER and the top 999 having a cumulative ratio of 40968.36 per 100K Americans. Not bad.
Jumping down to the 10,000th most common surname, we see LITTLES, which is tied for 9,998th place with a cumulative proportion of 68.4%:
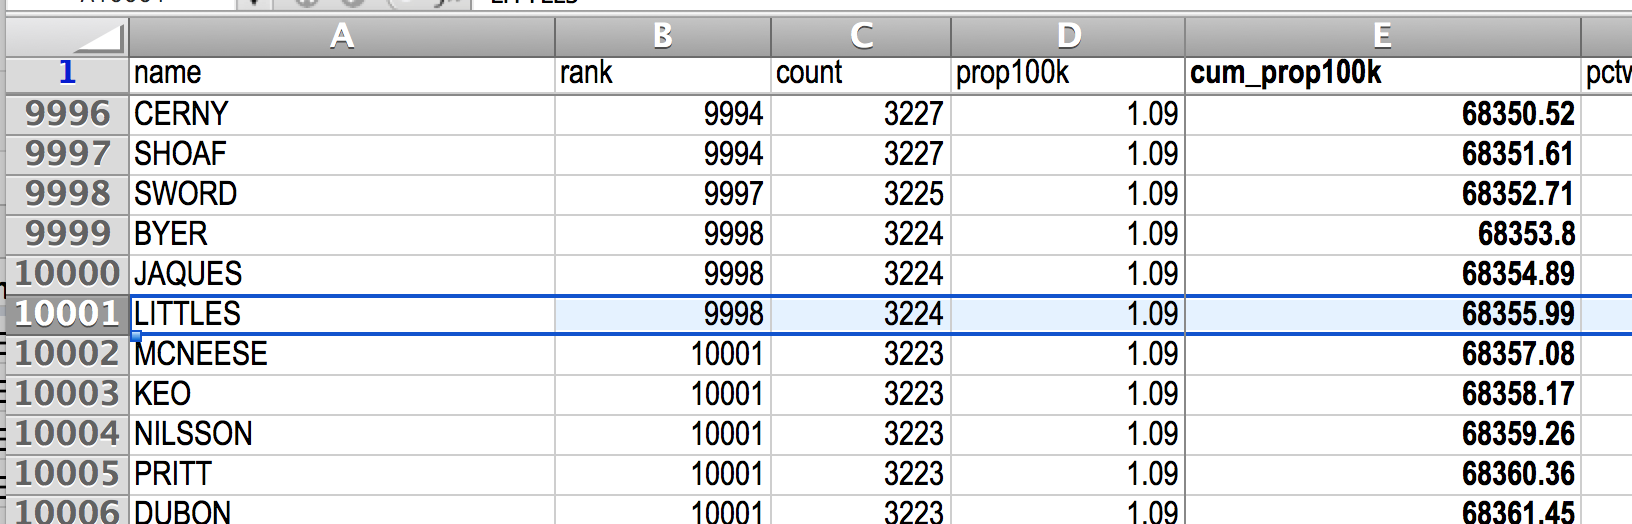
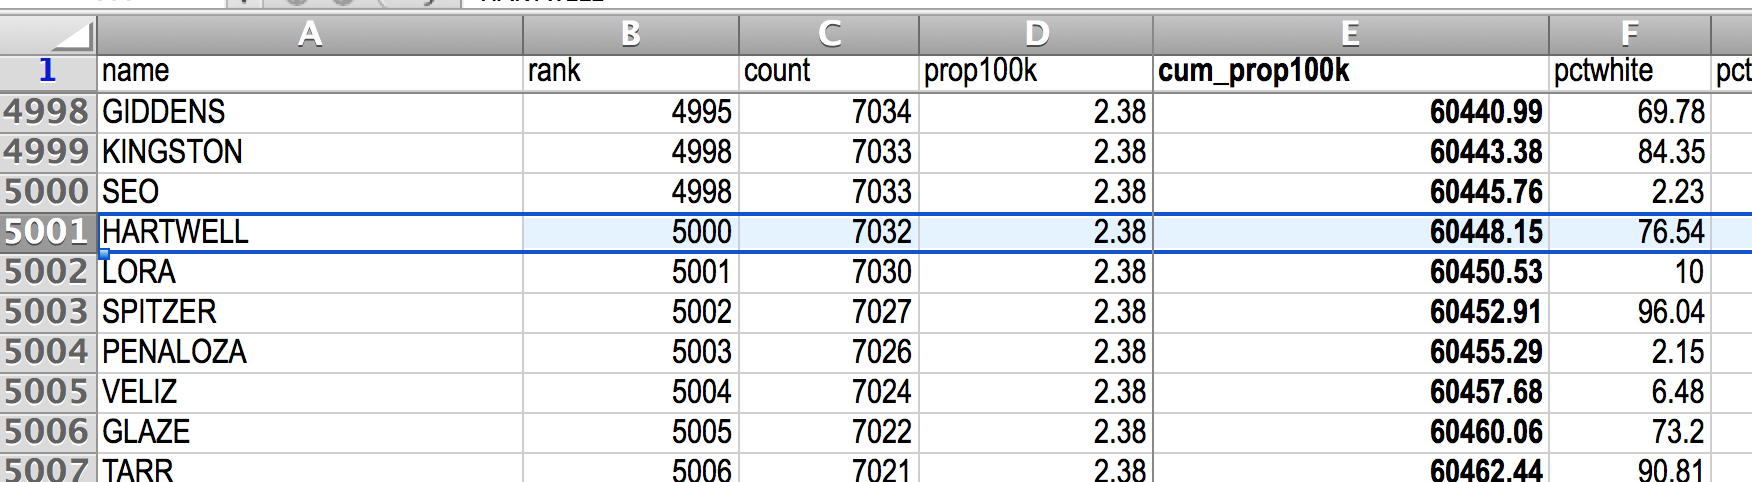
Maybe it’s diminishing returns at this point? I’m settling for the 5,000th most popular name, so that the compiled spreadsheet between 2000 and 2010 will have a nice, round 10,000 rows. Plus, the 5,000th most common surname has a cumulative proportion of 60.45%:
Calculating a cumulative value in a spreadsheet
The cum_prop100k-type calculation is usually one that I cut out, partly because I don’t use cumulative values often in analysis. And partly because they’re easy enough to derive if I do need them.
This section is a quick segue to reinforce the concept of spreadsheet formulas and repeatable calculations.
(warning: again, because the Census data is large, your computer might slow to a crawl during this process)
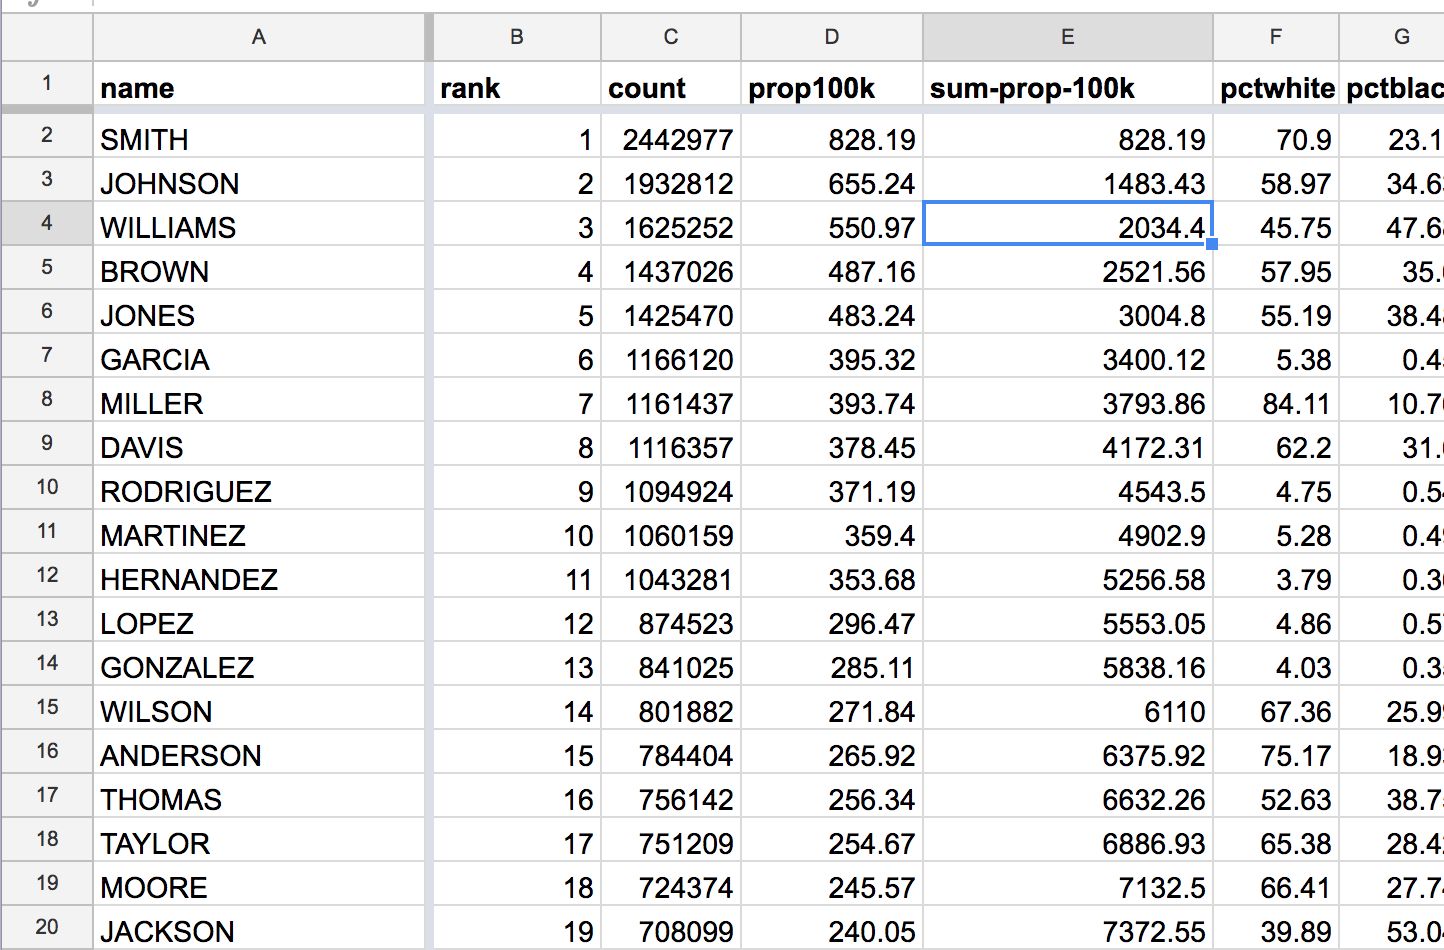
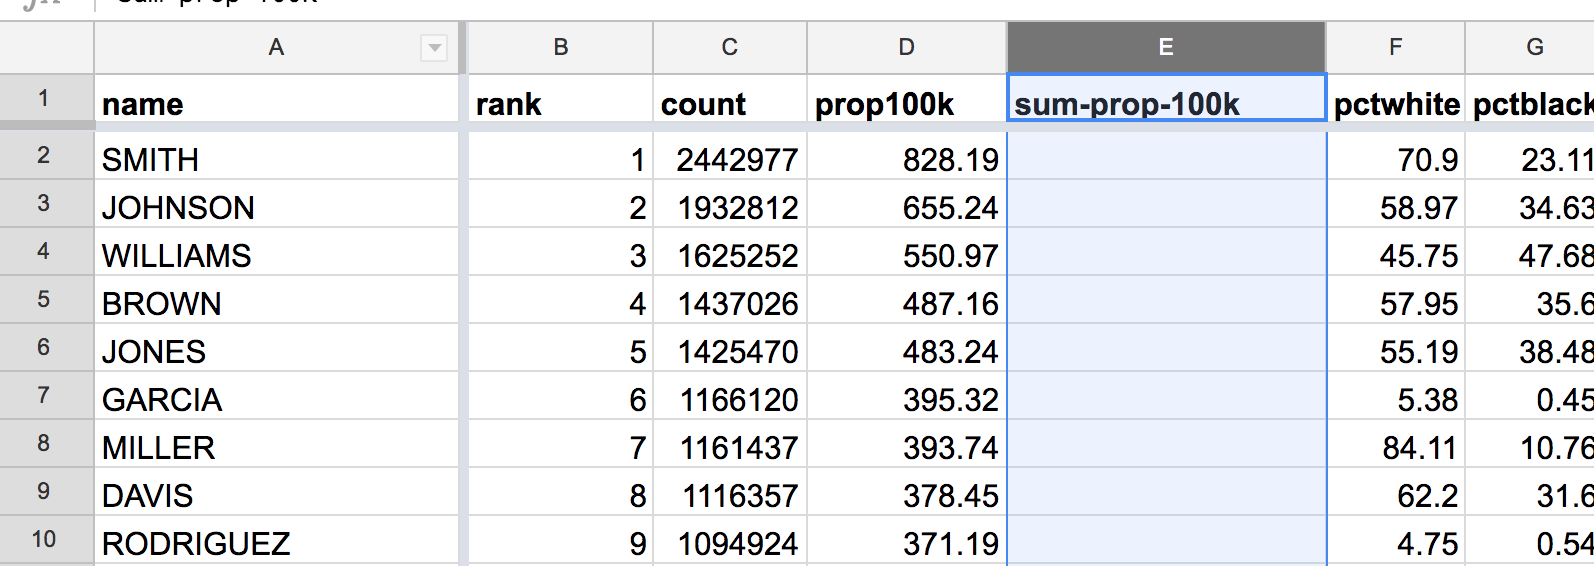
Go to your copy of the Census 2010 surnames spreadsheet and insert a new column – right after the existing prop100k column is probably the most convenient. I’m naming my column sum-prop100k:
Let’s tackle this one row at a time. The 1st-ranked name of SMITH has a prop100k value of 828.19. It stands to reason that, for the rank of 1, the sum of the prop100k values so far is simply 828.19.
The power of derivation
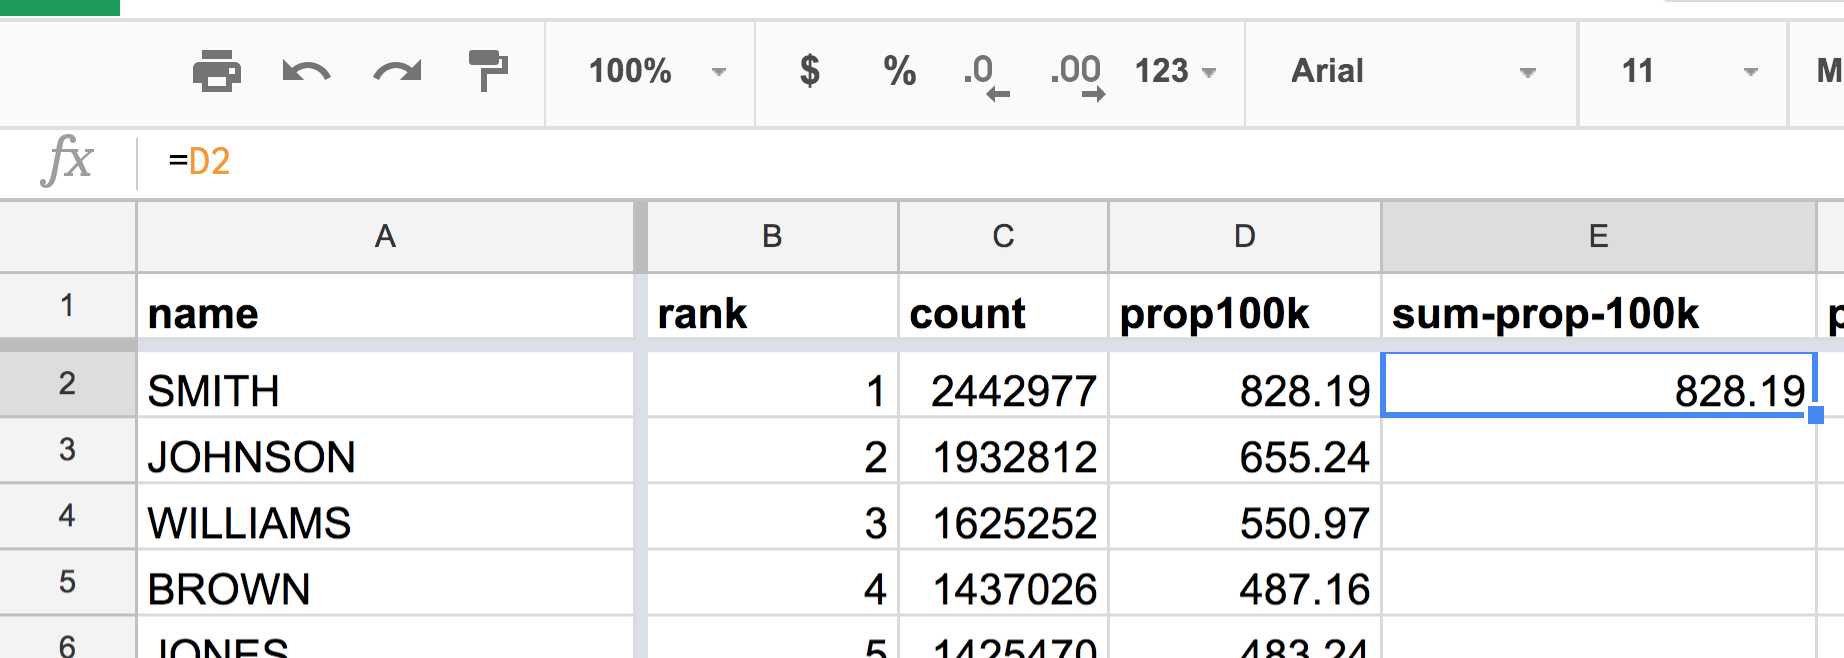
However, don’t copy-paste the literal value of 828.19. Use a spreadsheet formula to indicate that the value of the E2 cell should be equal to the value of the D2 cell:
=D2
Notice how the cell displays the derived value, even as its actual value is the text string =D2 (in the formula bar):
Now for cell E3, which is the cumulative value for the 2nd-ranked name, JOHNSON, which has a prop100k value of 655.24. The cumulative value is simply the sum of that with the previous cumulative value, 828.19. Again, don’t include the literal values, even as a formula:
=655.24 + 828.19
But use references to those values, i.e. the cells that contain those values:
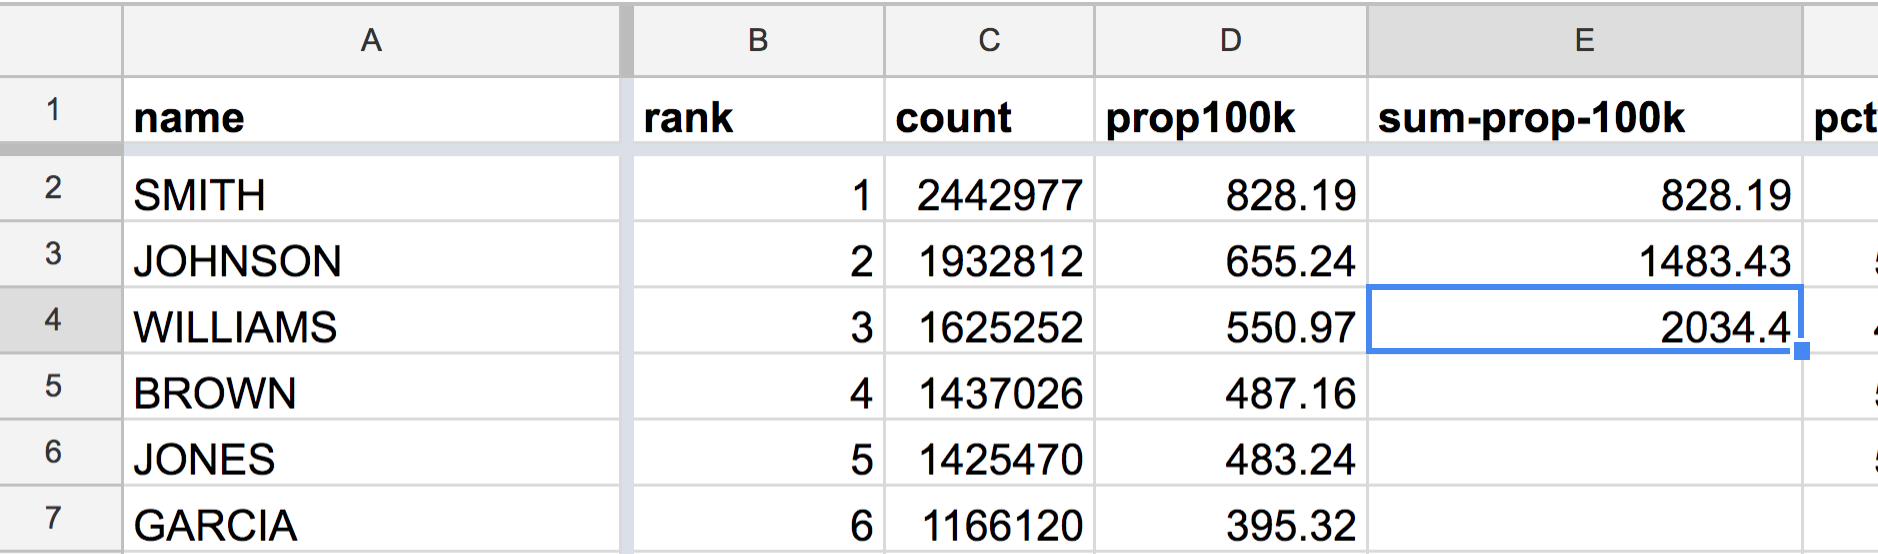
=E2 + D3
The value of cell E3 is the result of adding the cells E2 (the previous cumulative prop100k value) and D3 (JOHNSON’s prop100k value) together.
Another way to describe that is:
Add the value of the E column in the previous row with the value of the D column in this row.
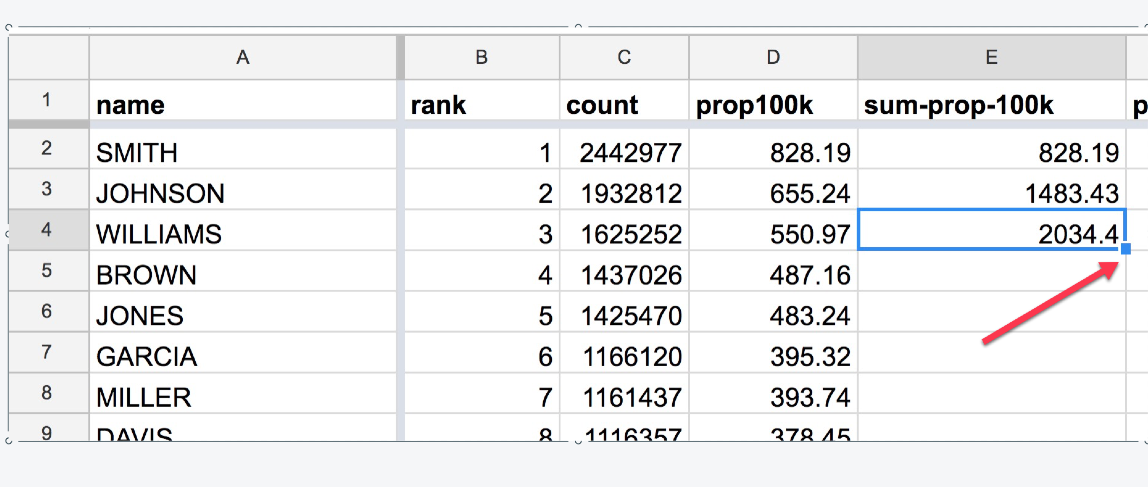
The next cell, E4, can be calculated with this:
=E3 + D4
The math seems to add up…
At this point, the spreadsheet is smart enough to get the pattern in the E column.
To fill the rest of E, highlight the last-filled E cell (e.g. E4), and double-click the blue square in the bottom-right corner:
Magic! (this may take awhile to fill 160,000+ rows)