Setting up the Spreadsheet for Friendly Usability
Overview
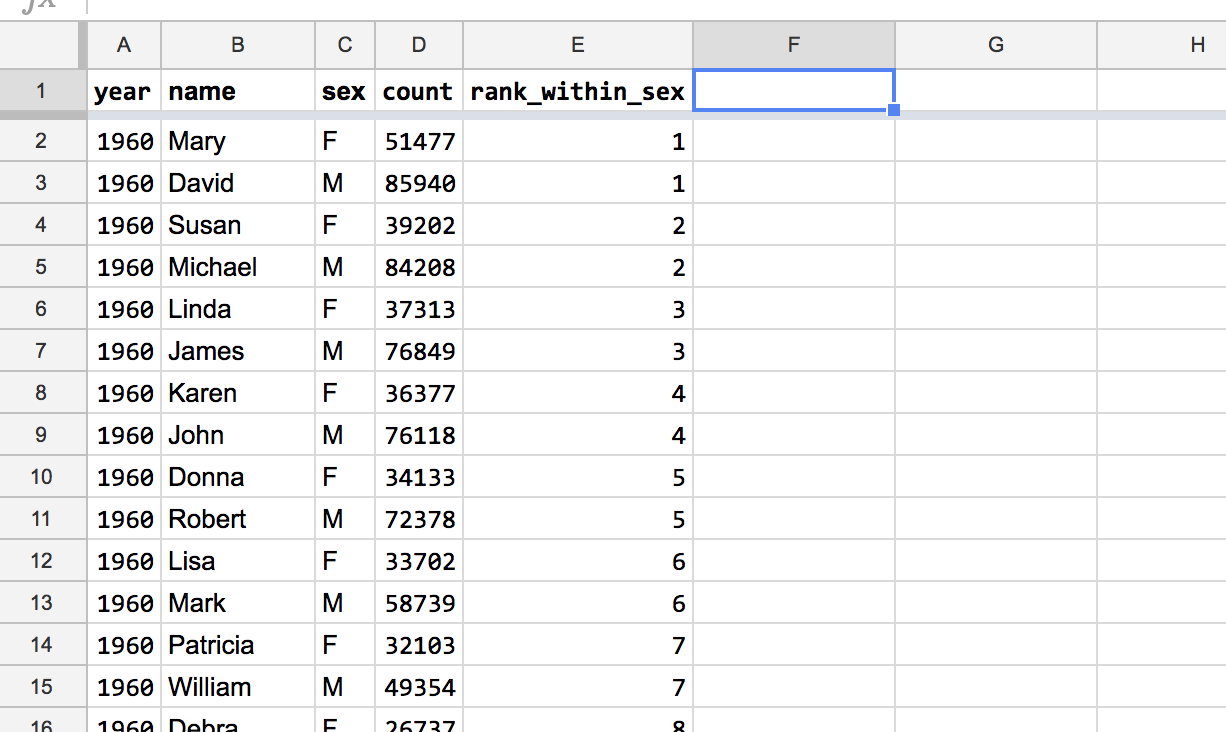
The starting spreadsheet:
https://docs.google.com/spreadsheets/d/1iBvBFNRiRaiHKScf9PJWj53_ghvLPfwqPtseczHnZ4M/edit#gid=0
The “friendly” spreadsheet:
https://docs.google.com/spreadsheets/d/1KgwNJjLkoNkC2TclxZpyhkW9arbOeZgT5aEs-kiJ66o/edit#gid=0
Create the header row
For a spreadsheet with a non-trivial number of rows, we want to create a header row that allows us to scroll through the many rows while being able to easily see the column heads:
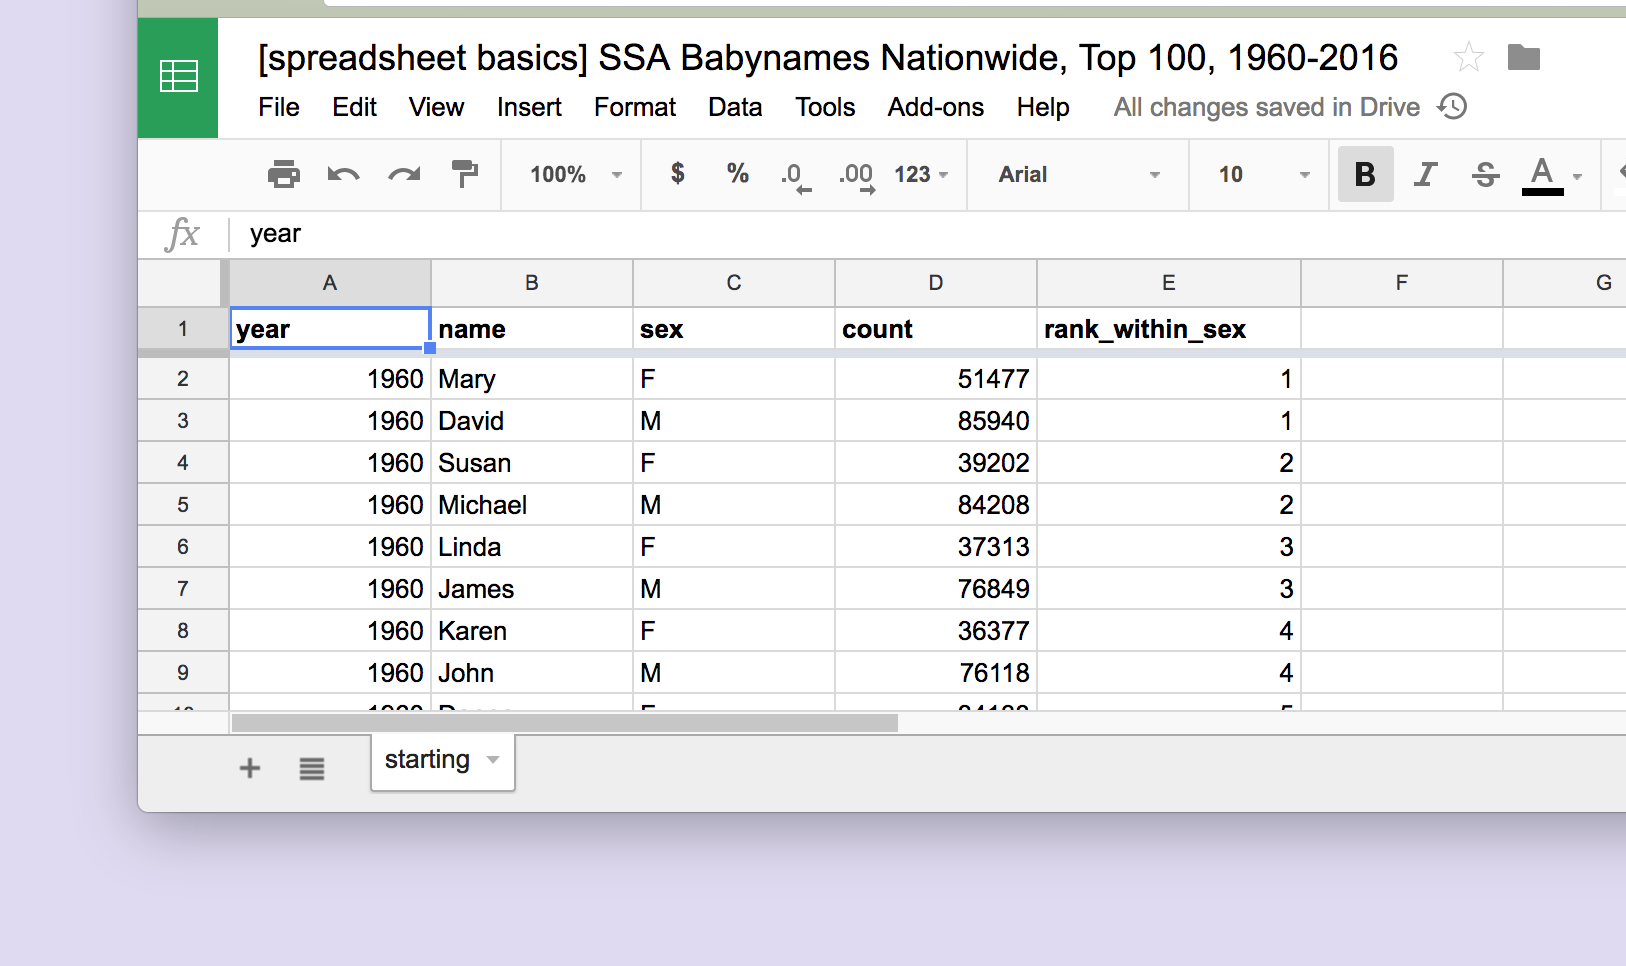
Notice how the header row stays the same even as the spreadsheet has been navigated down to its 8635th row:
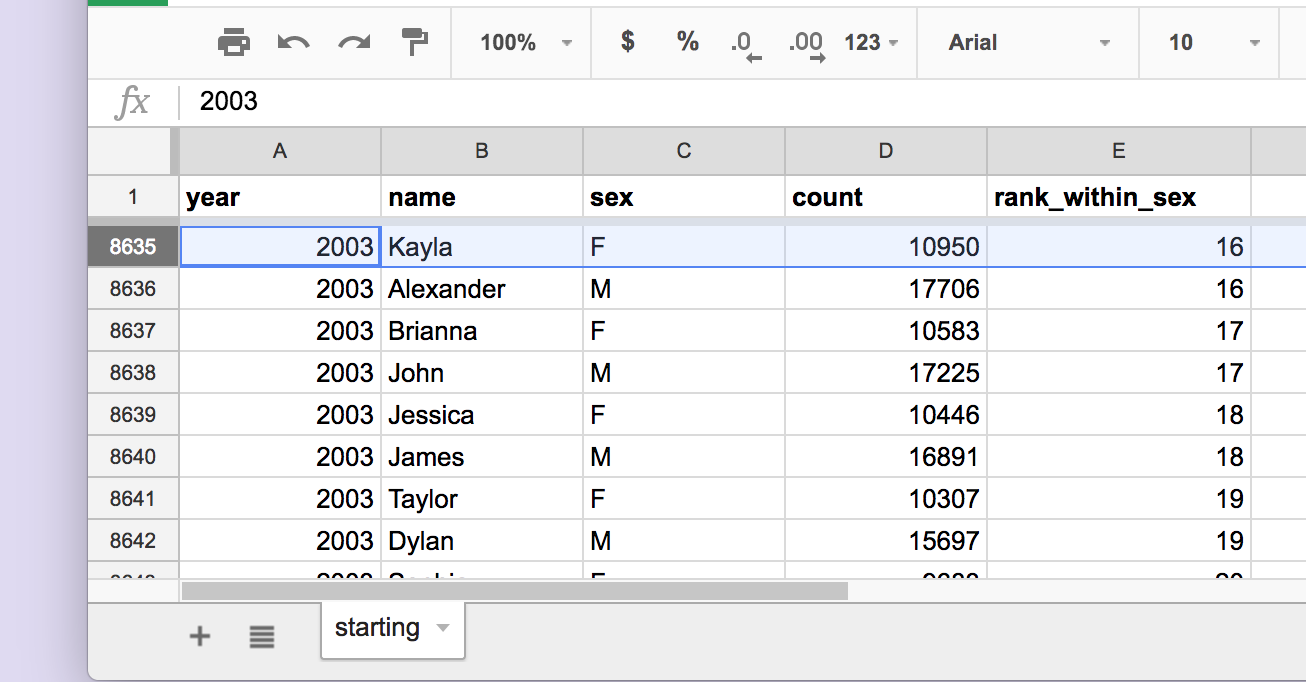
Freeze the first row as header

Using the menu action to freeze the header
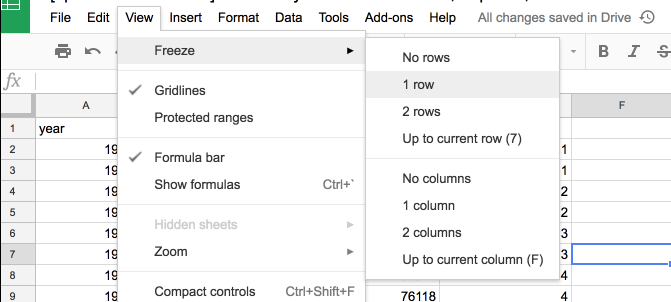
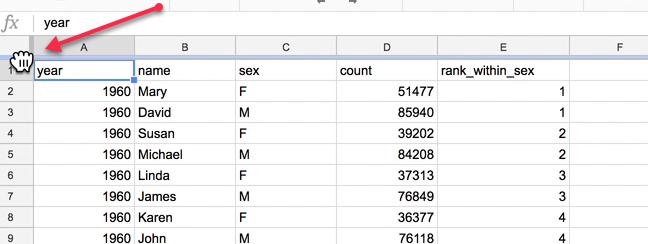
Click-and-drag the frozen header
Bold the text in the header row
Select the entire row by clicking the row number
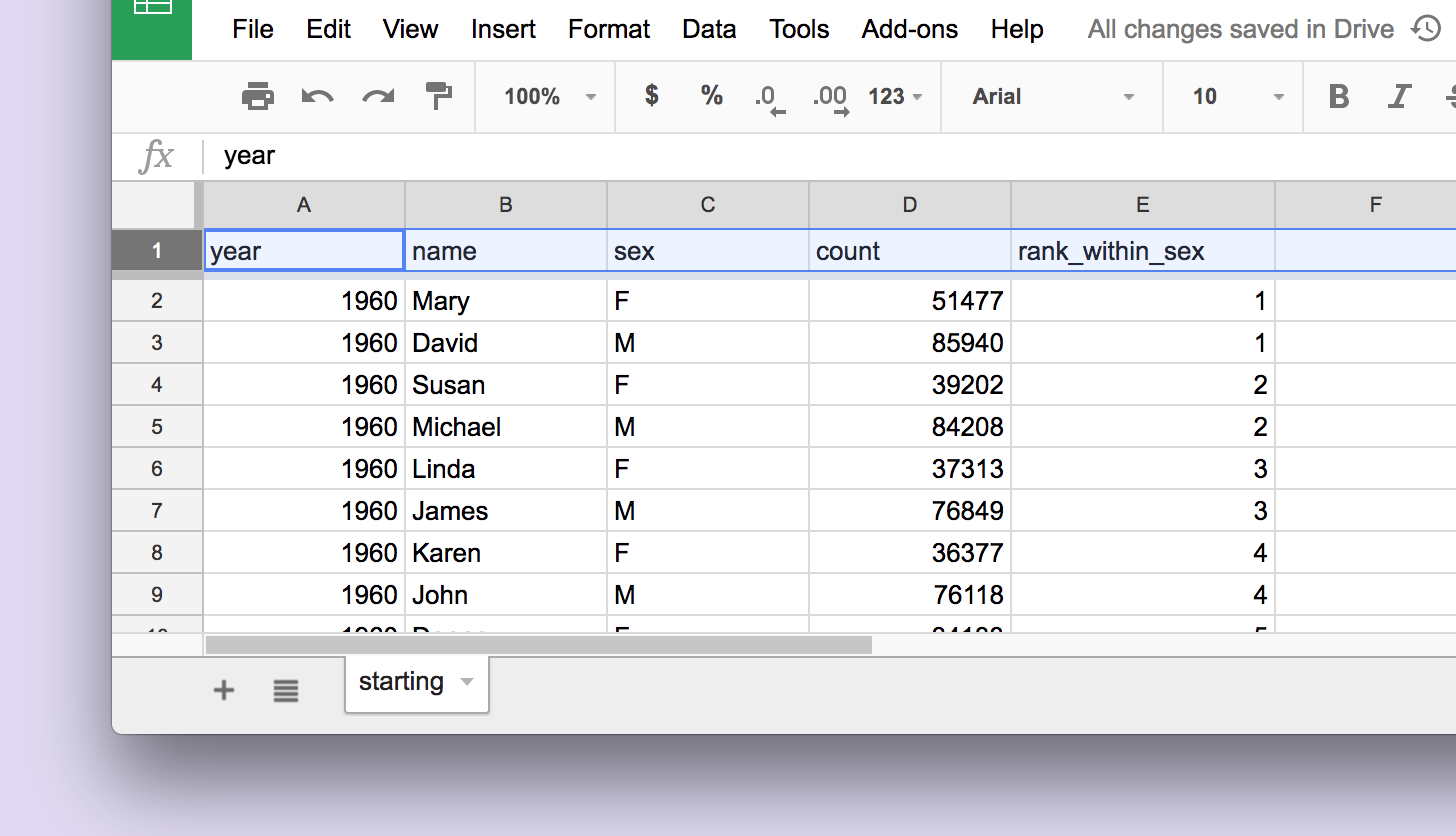
Bold the selected text
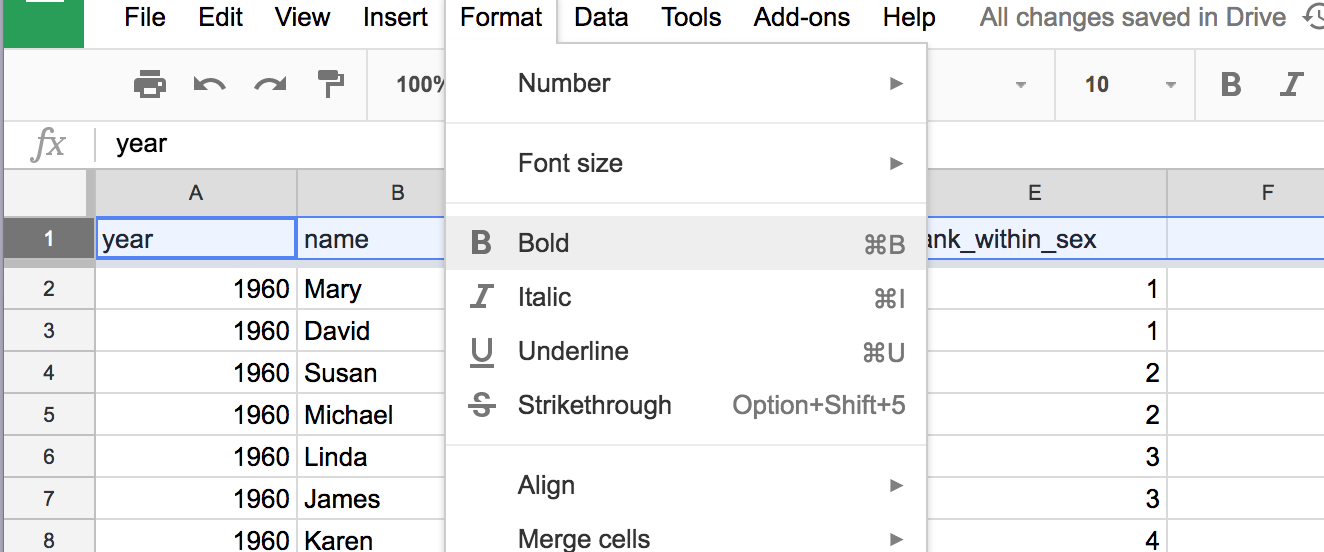
Using the keyboard shortcut: Command+B
Using the menu action: Format >> Bold
Using a monospace font for numerical values
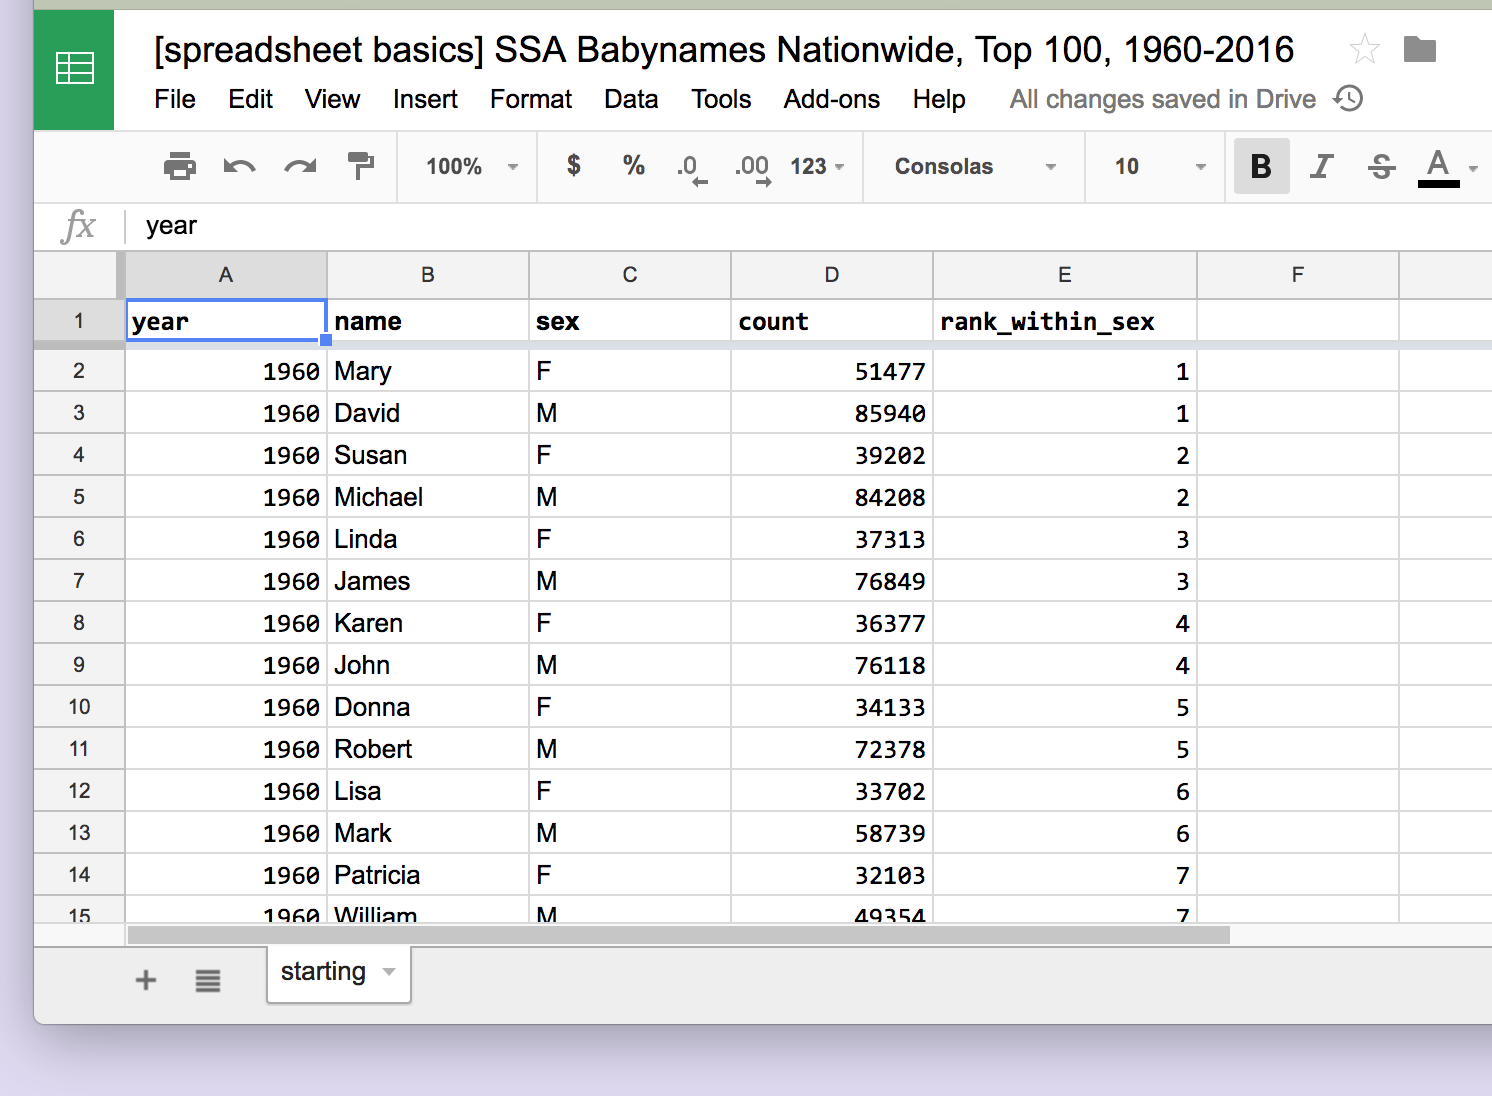
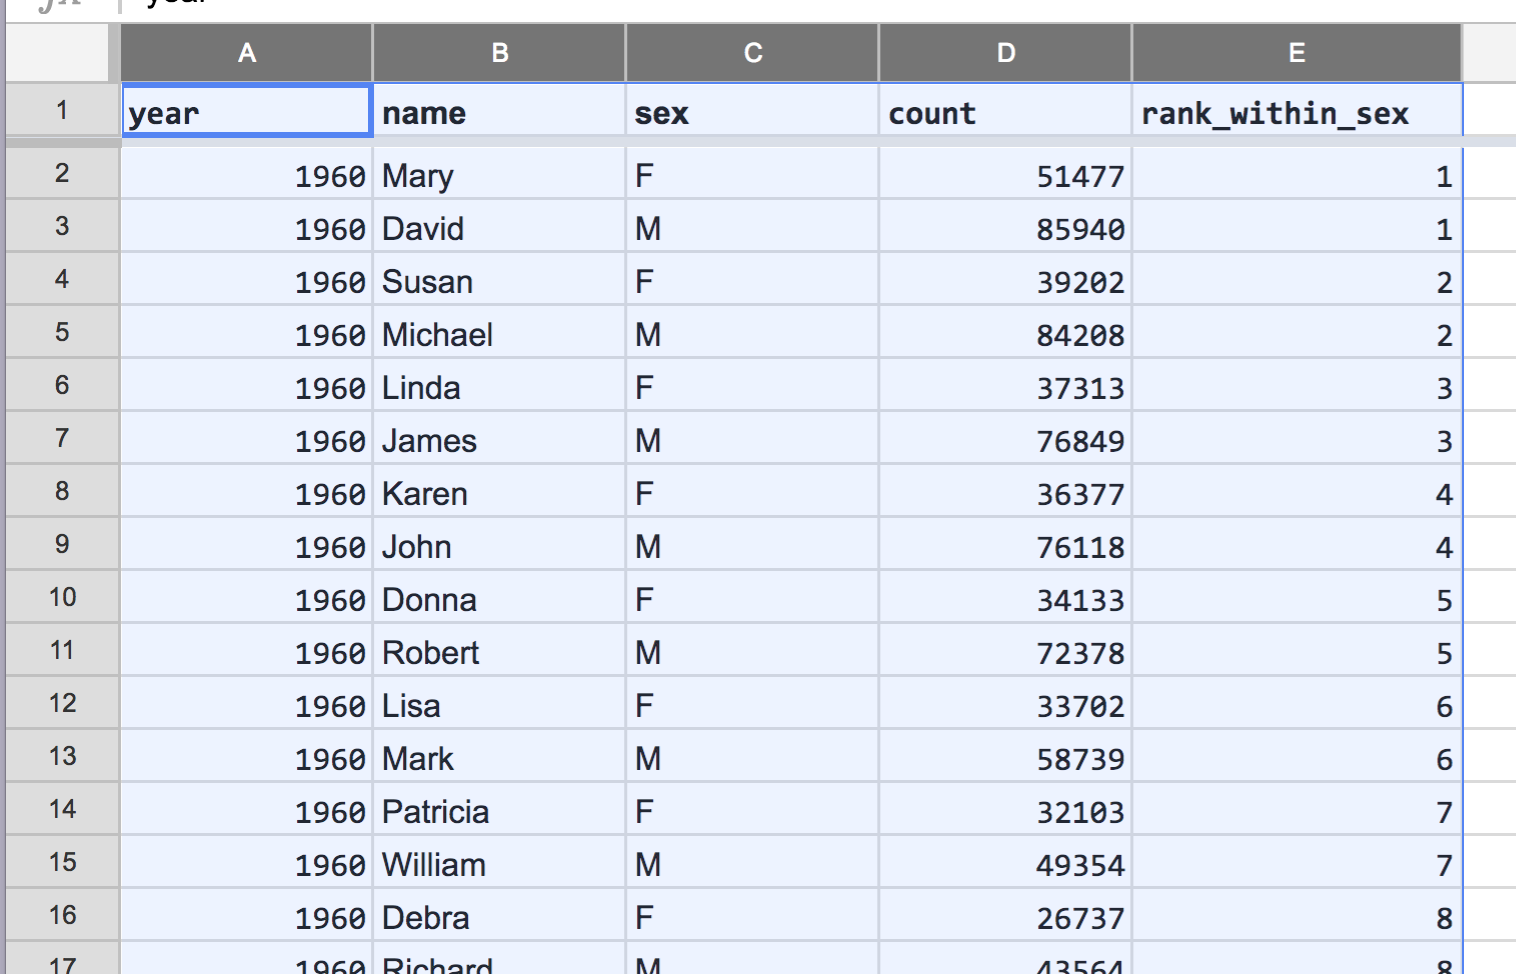
End result is that the 3 numerical columns – year, count, and rank_within_sex, are set to a monospace font:
The impact of font style when looking at numerical data
Why does modern spreadsheet software, by default, right-aligns text that represents numerical values?
To see this in action, in any spreadsheet, enter in text values, such as 9 and nine and 9 + 9:
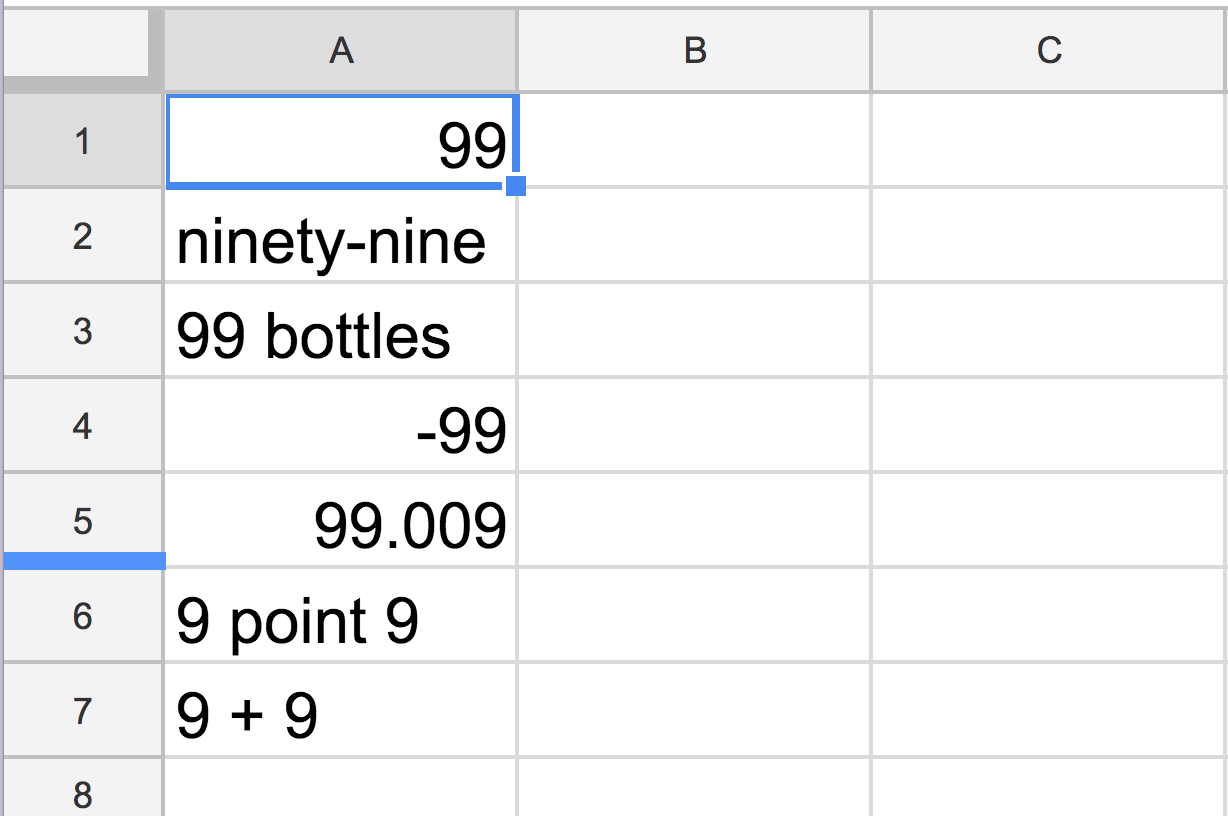
In any kind of tabular presentation, whether it be a spreadsheet or a table you draw up by hand, make sure that columns of numerical values are:
- Are right-aligned
- Use a monospace font
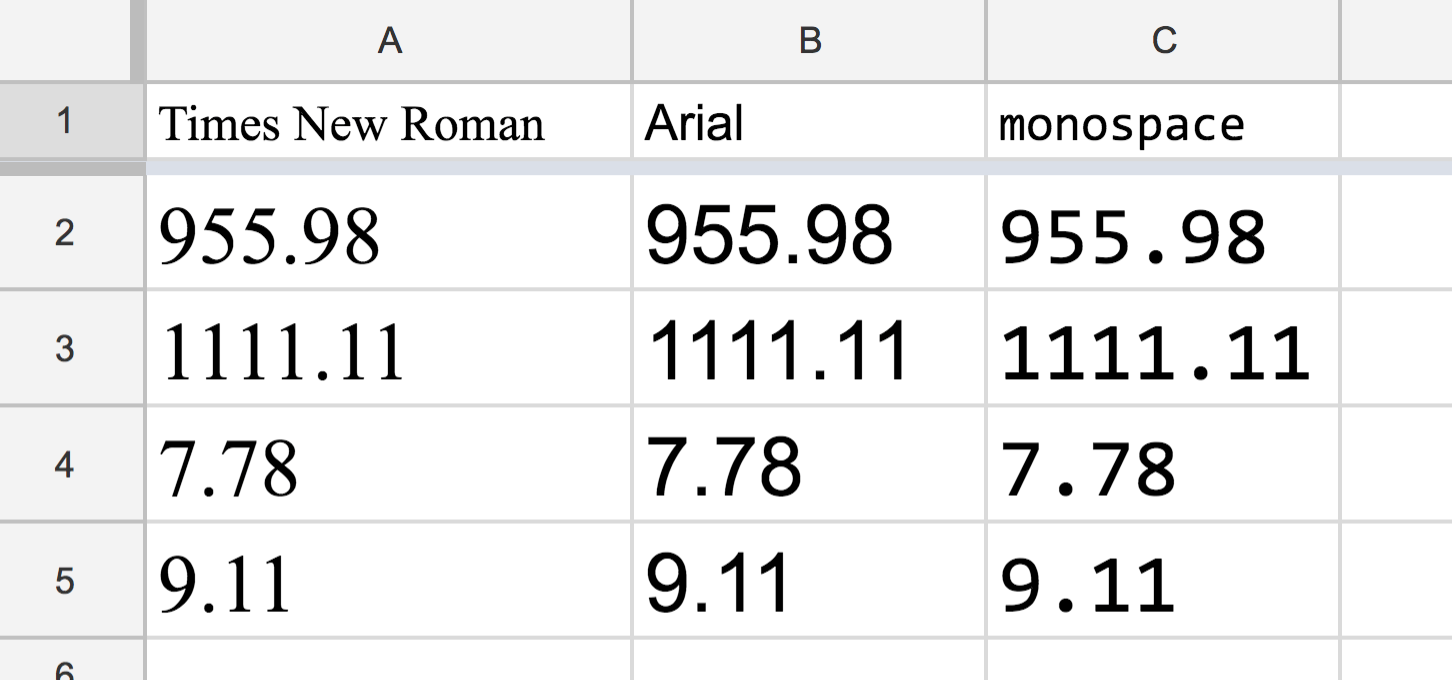
Let’s look at numerical values in which the values are left-aligned, using a variety of fonts:
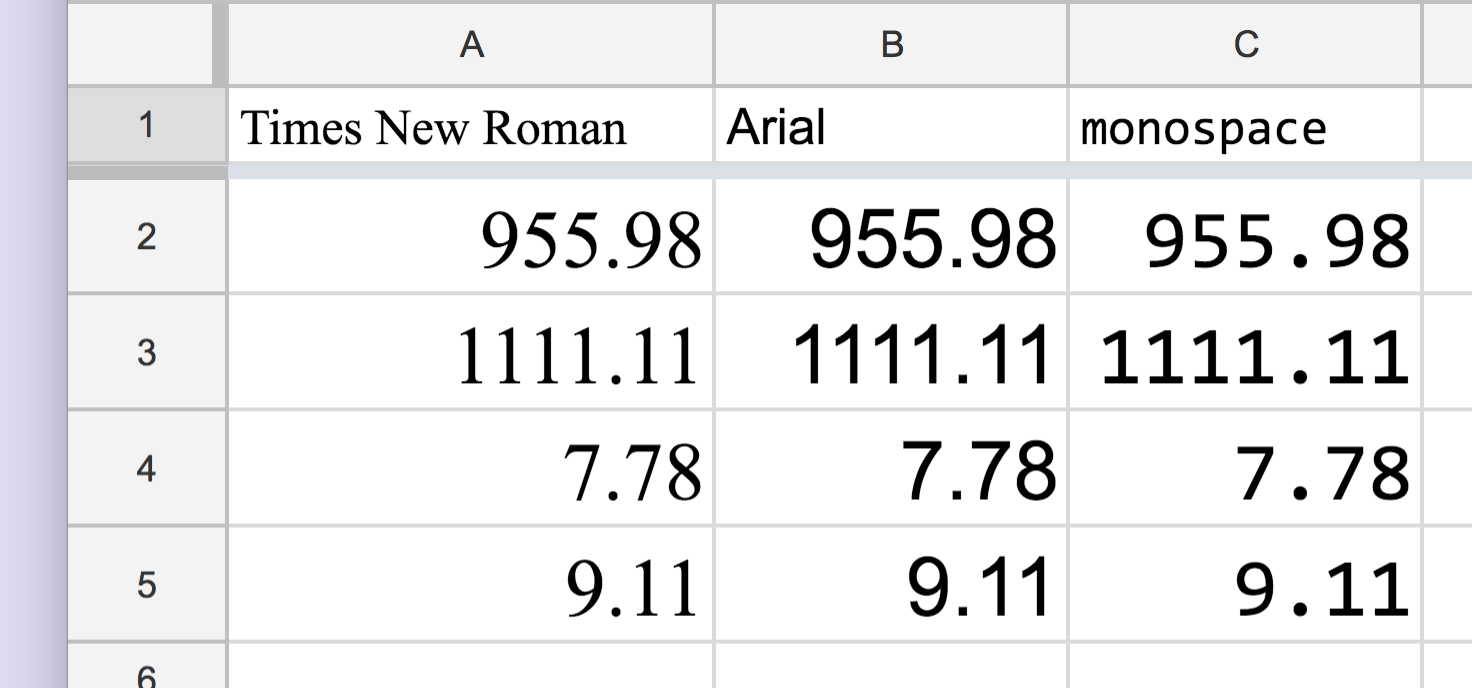
With right-alignment, there is a little more order to things. Note how the significant places for each number are lined up correctly, e.g. the hundredths values and the hundreds values:
Padding numbers for clarity
This doesn’t impact our current data wrangling, but when dealing in values with varying decimal precision, sometimes it’s necessary to format values so that they all have the same physical width:
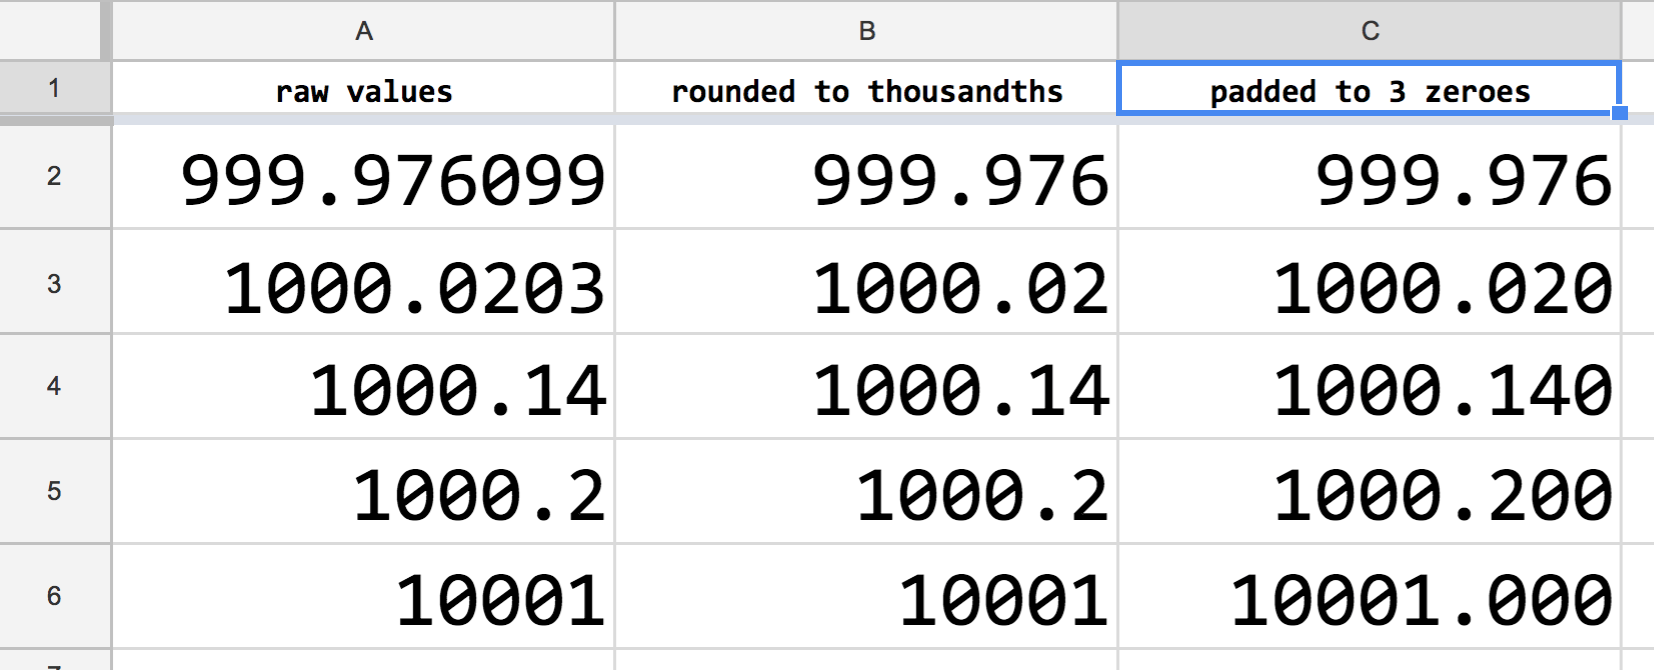
- raw values are just the “naked”, actual values of the numbers, down to their most specific decimal point whether it is millionths or in ones
- rounded to thousandths are the “raw” values rounded to the thousandths – or 3rd* decimal place. If a number doesn’t have that precision, no additional zeroes are added, i.e.
1000.14remains1000.14. - padded to 3 places are the values formatted such that they always show 3 decimal places. The value
1000.2is “padded” with extra zeroes to look like1000.200. The effect is merely visual, as both numbers are equal.
Select entire columns of data
Selecting a single column
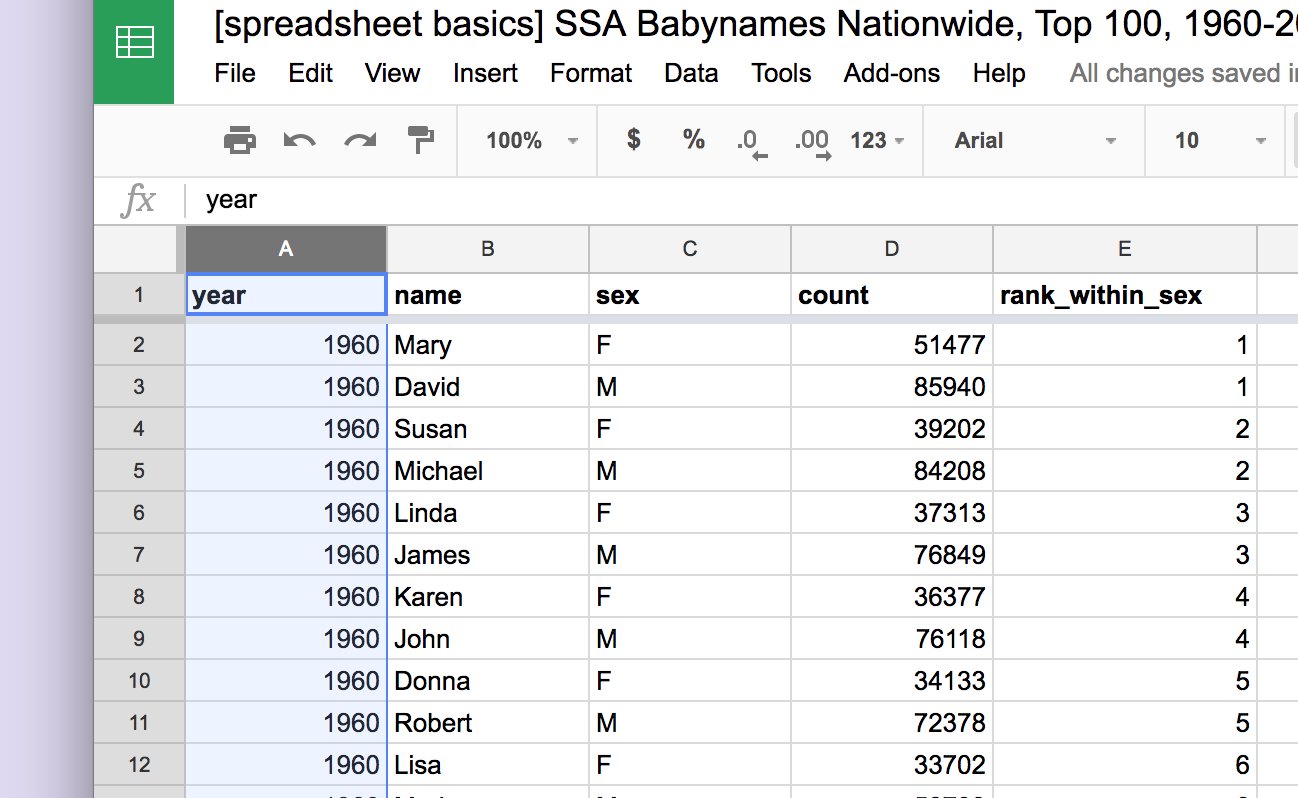
Clicking the column label of a column – e.g. A for year – will highlight and select the entire column with the given label:
Adding multiple columns to the selection
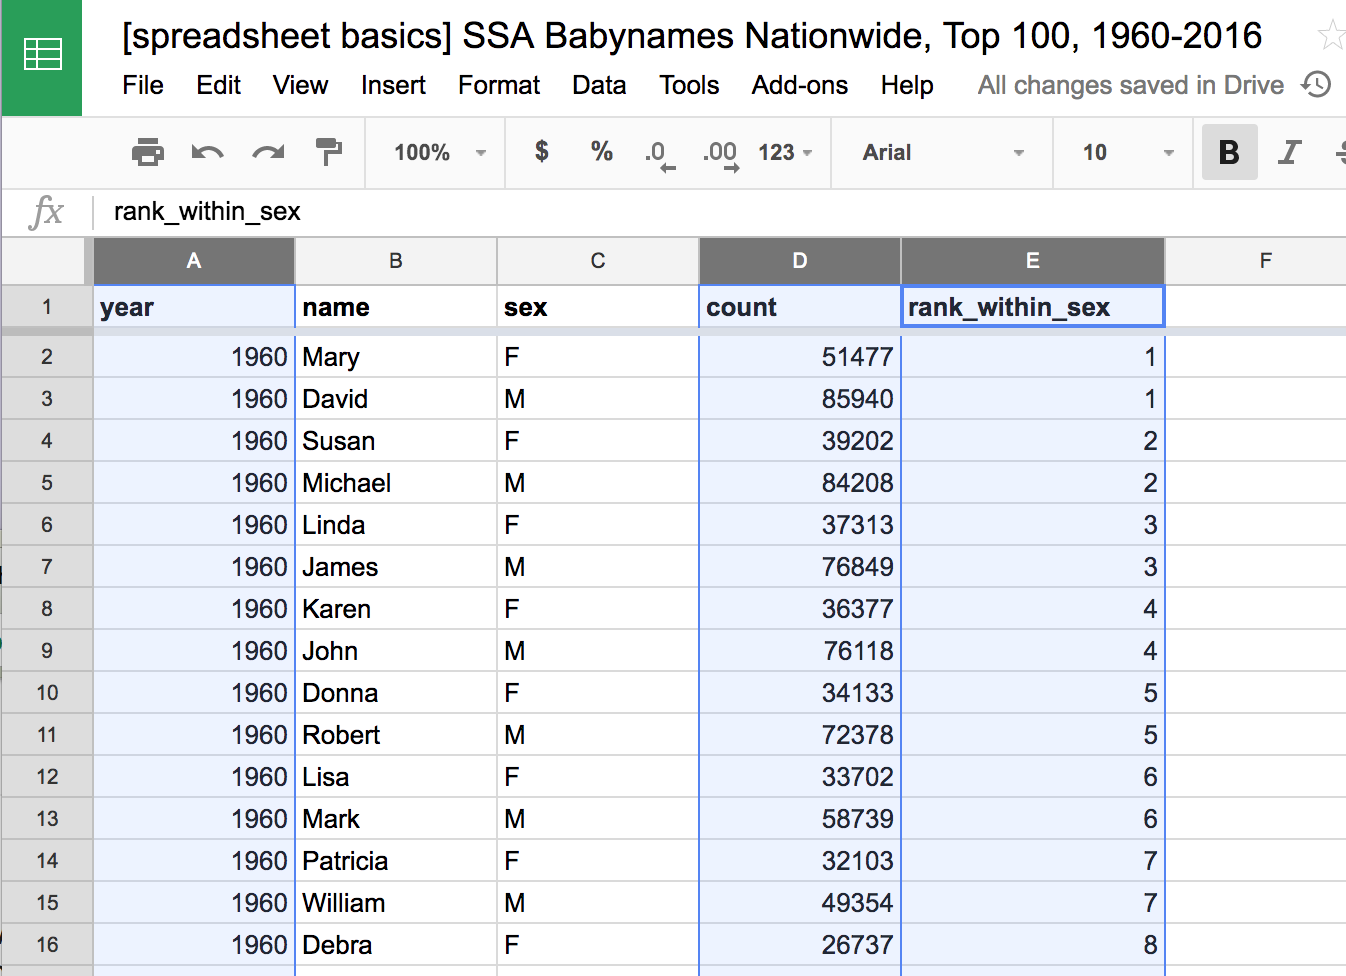
To add additional columns to the current selection:
- OSX: Hold
Commandwhile clicking each column label - Windows: Hold
Ctrlwhile clicking each column label
Picking the monospace font from the toolbar
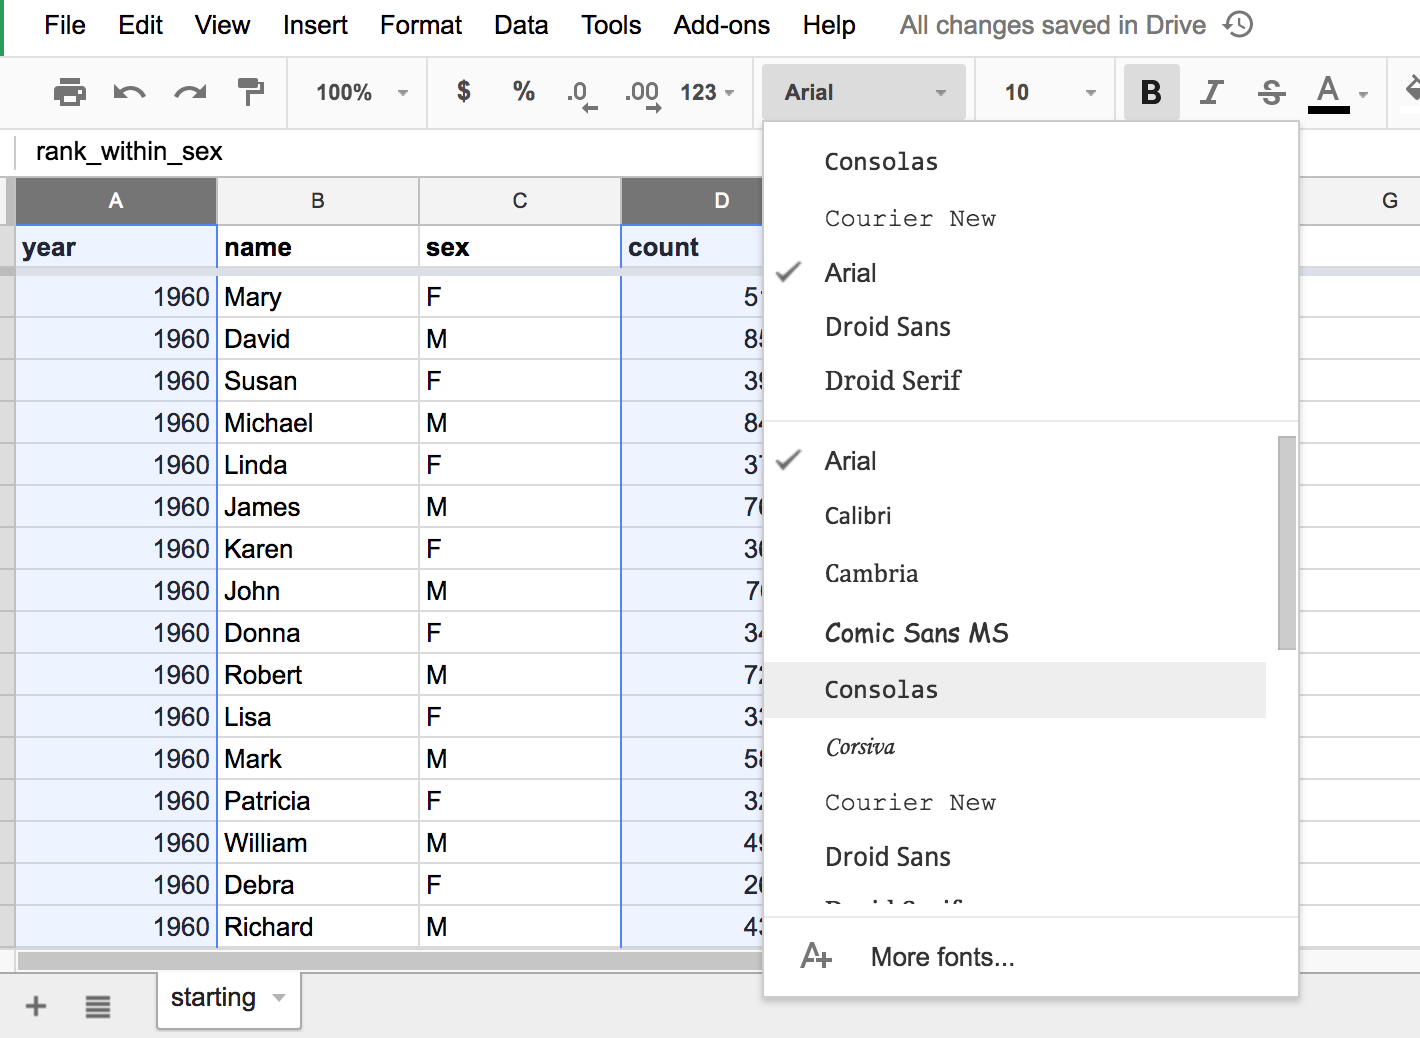
I don’t think there is a keyboard shortcut or menu action for changing fonts (other than bold vs italic and font size). So look on the toolbar for Arial, or whatever the spreadsheet’s default font name. Click to bring a dropdown menu of available fonts.
I prefer Consolas, though Courier New is almost guaranteed to be on any system:
Resizing columns to their max width
- Select column A by clicking on the label A.
- Hold down the
Shift-key - Click on label E to select every column, A through E
Right-click the selection to bring up a pop-up context menu.
Then select the action, Resize columns A - E…

This brings up a dialog box which asks if you want to format the columns by a fixed with (such as 100 pixels), or to format each column by their widest data value, i.e. Fit to data. Select the Fit to data option:
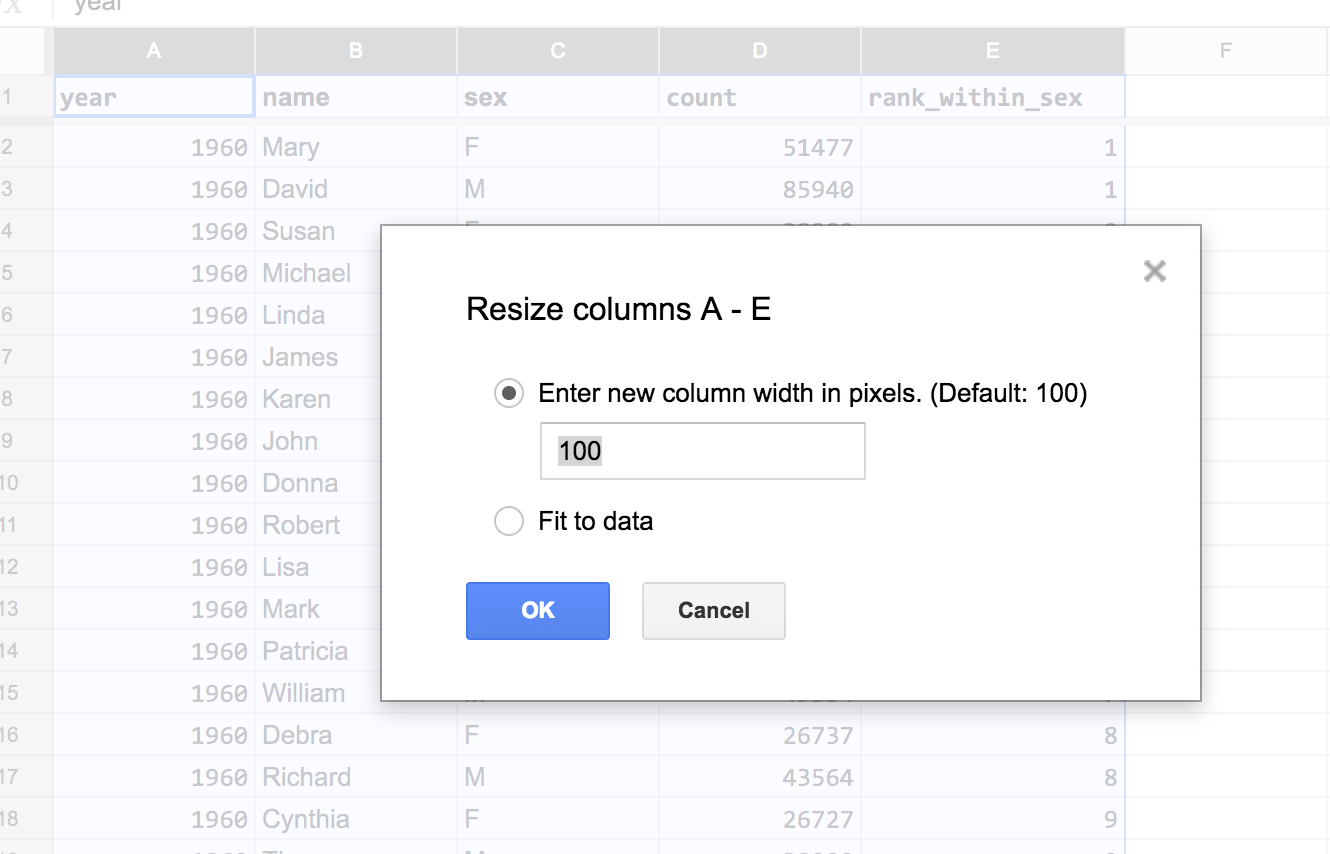
The result is something quite a bit narrower:
